





Portfolia
Přidat do nového portfolia

Sledovat
![]() v reálném čase
Získejte aktualizace v reálném čase prostřednictvím nabízených oznámení v aplikaci.

Otevřít aplikaci

xStocks
$108,998M
40.3%
Objem obchodování za 24 h.
🆕
New Listings


xStocks Tokenized Assets
| # | Coin | RWA | Cena | Price Diff vs RWA | 1h % | 24 h % | 7 d % | 30 d % | 24h Volume | Trž. kap. | FDV | Market Cap / FDV | 24h objem perps | 24h OI perps | Posledních 7 dní | |
|---|---|---|---|---|---|---|---|---|---|---|---|---|---|---|---|---|
| 1 |
 Nvidia |
$130,98 | 0.8% | 0.3% | 4.4% | 17.4% | 38.1% | $11 215 532 | $111 315 444 | $238 315 680 | 0,47 | $94 367 341 | $10 874 908 |  |
||
| 2 |
 Strategy PP Variable |
$101,46 | 8.1% | 0.6% | 0.4% | 6.0% | 5.5% | $435 689 | $102 739 044 | $301 212 089 | 0,34 | - | - |  |
||
| 3 |
 Circle Internet Group |
$48,99 | 0.3% | 0.2% | 3.5% | 14.8% | 42.5% | $10 071 264 | $93 459 866 | $225 366 763 | 0,41 | $17 295 416 | $2 114 754 |  |
||
| 4 |
 Strategy |
$80,89 | 1.8% | 0.4% | 4.4% | 19.0% | 43.7% | $2 289 115 | $82 508 835 | $173 870 725 | 0,47 | $2 039 430 | $2 149 714 |  |
||
| 5 |
 SPDR S&P 500 ETF Trust |
$705,21 | 1.1% | 0.2% | 1.9% | 6.1% | 8.1% | $3 921 882 | $74 925 202 | $198 012 945 | 0,38 | $353 541 | $1 706 936 |  |
||
| 6 |
 SpaceX |
$130,78 | 0.9% | 0.1% | 2.4% | 2.3% | 10.2% | $2 635 193 | $74 318 559 | $223 697 158 | 0,33 | - | - |  |
||
| 7 |
 Invesco QQQ ETF |
$623,60 | 0.9% | 0.2% | 2.5% | 6.8% | 11.4% | $1 668 414 | $72 718 540 | $203 732 076 | 0,36 | $481 698 | $1 419 878 |  |
||
| 8 |
 Alphabet Class A |
$274,29 | 1.6% | 0.4% | 3.3% | 4.5% | 15.6% | $4 340 437 | $63 474 170 | $175 771 083 | 0,36 | $49 468 001 | $5 767 195 |  |
||
| 9 |
 Tesla |
$354,97 | 1.2% | 0.0% | 2.7% | 7.4% | 4.9% | $7 555 799 | $62 358 174 | $207 445 082 | 0,30 | $843 223 | $1 217 486 |  |
||
| 10 |
 Intel |
$53,13 | 0.2% | 0.1% | 3.8% | 6.0% | 37.3% | $223 443 | $25 808 350 | $127 664 000 | 0,20 | $116 965 | $212 620 |  |
||
| 11 |
 SanDisk |
$81,40 | 0.0% | 0.0% | 88.5% | 90.6% | 93.8% | $435 202 | $19 204 249 | $217 445 622 | 0,09 | - | - |  |
||
| 12 |
 iShares $ Treasury Bond 0-1yr UCITS ETF |
$121,80 | 0.7% | - | 0.0% | 0.0% | 0.2% | - | $18 960 097 | $18 960 097 | 1,00 | - | - |  |
||
| 13 |
 Apple |
$351,01 | 1.8% | 0.0% | 2.1% | 1.7% | 0.4% | $6 189 607 | $12 541 828 | $234 346 835 | 0,05 | $934 507 | $4 152 659 |  |
||
| 14 |
 SK Hynix - ADR |
$107,60 | 1.2% | 0.0% | 3.7% | 15.2% | 17.9% | $56 487,49 | $11 019 329 | $69 161 961 | 0,16 | - | - |  |
||
| 15 |
 Coinbase |
$104,26 | 1.7% | 0.1% | 2.2% | 12.2% | 38.2% | $4 345 068 | $10 611 438 | $100 045 429 | 0,11 | $50 623 428 | $12 005 441 |  |
||
| 16 |
 SPDR Gold Shares |
$325,08 | 0.2% | 0.1% | 1.1% | 6.6% | 11.6% | $2 538 972 | $9 715 394 | $115 611 754 | 0,08 | $270 313 | $549 535 |  |
||
| 17 |
 Amazon |
$254,35 | 1.4% | 0.0% | 3.3% | 2.8% | 1.7% | $4 898 162 | $9 549 539 | $141 480 189 | 0,07 | $19 797 022 | $4 110 992 |  |
||
| 18 |
 Meta Platforms |
$571,58 | 0.7% | 0.0% | 1.8% | 9.4% | 11.5% | $2 974 710 | $9 185 613 | $129 508 045 | 0,07 | $4 879 480 | $8 432 360 |  |
||
| 19 |
SPDR S&P 500 ETF Trust
|
$706,26 | 1.3% | 0.1% | 1.8% | 6.2% | 7.9% | $2 133 819 | $8 533 988 | $8 533 988 | 1,00 | - | - | 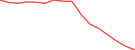 |
||
| 20 |
 Microsoft |
$498,78 | 1.9% | 0.0% | 2.8% | 4.3% | 4.7% | $387 626 | $7 506 487 | $150 635 801 | 0,05 | - | - |  |
||
| 21 |
 Robinhood Markets |
$64,32 | 0.1% | 0.1% | 4.2% | 12.8% | 33.0% | $4 192 383 | $7 484 072 | $133 967 162 | 0,06 | $2 565 243 | $353 930 |  |
||
| 22 |
 Advanced Micro Devices |
$439,96 | 0.1% | 0.0% | 4.1% | 15.7% | 13.3% | $475 009 | $6 357 869 | $165 638 547 | 0,04 | - | - |  |
||
| 23 |
Invesco QQQ ETF
|
$623,57 | 0.9% | 0.0% | 2.3% | 7.1% | 11.6% | $1 734 588 | $5 951 869 | $5 951 869 | 1,00 | - | - | 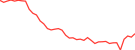 |
||
| 24 |
 Broadcom |
$315,98 | 1.3% | 0.2% | 4.5% | 6.1% | 2.4% | $1 681 214 | $5 793 536 | $91 097 187 | 0,06 | $4 895 388 | $72 815,08 |  |
||
| 25 |
 ProShares UltraPro QQQ |
$43,06 | 0.8% | 0.0% | 5.0% | 24.0% | 35.6% | $20 767,03 | $5 769 657 | $111 311 710 | 0,05 | $2 571 406 | $5 251 429 |  |
||
| 26 |
 Marvell Technology |
$125,49 | 0.0% | 0.0% | 3.8% | 18.8% | 43.3% | $8 856,53 | $4 933 773 | $140 449 335 | 0,04 | - | - |  |
||
| 27 |
 Taiwan Semiconductor Manufacturing - ADR |
$328,99 | 0.2% | 0.0% | 2.4% | 16.5% | 20.5% | $13 740,39 | $4 813 404 | $91 016 518 | 0,05 | - | - |  |
||
| 28 |
 Oracle |
$103,07 | 0.1% | 0.0% | 2.0% | 17.5% | 18.2% | $11 954,28 | $3 896 198 | $69 558 030 | 0,06 | $6 164,29 | $482 142 |  |
||
| 29 |
 BitMine Immersion Technologies |
$13,71 | 2.5% | 0.1% | 5.2% | 15.8% | 39.7% | $4 489,30 | $3 236 886 | $66 701 828 | 0,05 | - | - |  |
||
| 30 |
 Palantir Technologies |
$147,06 | 1.0% | 0.0% | 2.8% | 9.7% | 24.8% | $17 693,39 | $2 499 094 | $153 625 987 | 0,02 | $14 542,72 | $8 697,76 |  |
||
| 31 |
 iShares $ Treasury Bond 1-3yr UCITS ETF |
$5,95 | 0.9% | - | 0.1% | 0.3% | 0.5% | - | $2 463 937 | $2 463 937 | 1,00 | - | - |  |
||
| 32 |
Nvidia
|
$130,98 | 0.8% | 0.2% | 4.3% | 16.4% | 38.2% | $6 478 966 | $2 452 904 | $2 452 904 | 1,00 | - | - |  |
||
| 33 |
 GameStop |
$26,77 | 0.1% | 0.0% | 0.0% | 6.1% | 5.3% | $507 023 | $2 281 966 | $131 619 505 | 0,02 | - | - |  |
||
| 34 |
SpaceX
|
$130,74 | 0.9% | 0.0% | 2.4% | 2.4% | 10.2% | $386 174 | $2 218 473 | $2 218 473 | 1,00 | - | - |  |
||
| 35 |
 Berkshire Hathaway |
$564,78 | 1.0% | 0.0% | 0.0% | 3.8% | 3.2% | $60 863,58 | $2 198 042 | $112 246 249 | 0,02 | - | - |  |
||
| 36 |
 Netflix |
$57,11 | 0.1% | 0.1% | 0.2% | 7.3% | 15.0% | $5 699,20 | $2 143 717 | $204 740 421 | 0,01 | - | - |  |
||
| 37 |
 McDonald's |
$277,14 | 1.9% | 0.1% | 0.4% | 0.5% | 8.7% | $2 102 439 | $2 039 353 | $93 203 736 | 0,02 | $132 683 | $911 608 |  |
||
| 38 |
Tesla
|
$354,89 | 1.2% | 0.1% | 2.8% | 7.3% | 5.0% | $459 357 | $1 991 354 | $1 991 354 | 1,00 | - | - |  |
||
| 39 |
 Vanguard Total Stock Market ETF |
$355,43 | 3.5% | 0.1% | 4.4% | 4.5% | 6.5% | $1 553,02 | $1 758 122 | $128 899 609 | 0,01 | - | - |  |
||
| 40 |
 iShares Silver Trust |
$38,22 | 2.5% | 0.0% | 1.7% | 12.4% | 23.9% | $1,99 | $1 644 144 | $57 516 627 | 0,03 | - | - |  |
||
| 41 |
 MARA Holdings |
$5,29 | 0.8% | 0.0% | 22.5% | 22.2% | 31.4% | - | $1 277 923 | $65 660 362 | 0,02 | - | - |  |
||
| 42 |
 Eli Lilly |
$1 350,93 | 0.4% | 0.0% | 0.1% | 5.9% | 3.2% | $2 150,68 | $1 249 845 | $155 763 875 | 0,01 | - | - |  |
||
| 43 |
 Coca-Cola |
$98,78 | 1.9% | 0.1% | 0.0% | 2.6% | 2.5% | $37 848,01 | $1 182 247 | $144 200 061 | 0,01 | $660 509 | $39 643,40 |  |
||
| 44 |
 ASML Holding NV |
$1 259,13 | 2.5% | 0.0% | 6.9% | 15.7% | 24.1% | - | $1 090 648 | $97 750 590 | 0,01 | - | - |  |
||
| 45 |
 IBM |
$224,72 | 0.1% | 0.0% | 1.0% | 7.7% | 8.7% | $18 043,16 | $991 353 | $86 011 633 | 0,01 | - | - |  |
||
| 46 |
 AppLovin |
$360,46 | 2.7% | 0.0% | 1.6% | 10.6% | 35.9% | - | $964 397 | $102 848 313 | 0,01 | - | - |  |
||
| 47 |
Circle Internet Group
|
$49,16 | 0.7% | 0.1% | 3.6% | 14.6% | 42.4% | $580 488 | $905 929 | $905 929 | 1,00 | - | - |  |
||
| 48 |
 Invesco Short Term Treasury ETF |
$106,16 | 0.3% | - | 0.5% | 0.6% | 1.7% | - | $888 374 | $627 705 504 | 0,00 | - | - |  |
||
| 49 |
 Chevron |
$212,37 | 1.4% | 0.0% | 1.0% | 2.8% | 6.9% | $17,46 | $794 601 | $129 580 534 | 0,01 | - | - |  |
||
| 50 |
 VanEck Semiconductor ETF |
$412,07 | 0.3% | 0.1% | 1.5% | 14.0% | - | $163 196 | $773 984 | $773 984 | 1,00 | - | - | 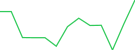 |
||
| 51 |
 CrowdStrike |
$212,90 | 2.3% | 0.0% | 13.4% | 7.5% | 10.7% | - | $755 589 | $197 690 845 | 0,00 | - | - |  |
||
| 52 |
SK Hynix - ADR
|
$107,36 | 1.0% | 0.0% | 4.2% | 15.7% | 18.0% | $329 958 | $717 954 | $717 954 | 1,00 | - | - |  |
||
| 53 |
 Micron Technology |
$610,43 | 0.2% | 0.3% | 3.4% | 18.8% | - | $374 189 | $675 178 | $675 178 | 1,00 | - | - | 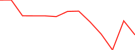 |
||
| 54 |
 Exxon Mobil |
$165,32 | 3.1% | 0.2% | 1.1% | 6.2% | 7.2% | $135,23 | $654 696 | $129 178 617 | 0,01 | - | - |  |
||
| 55 |
 iShares Russell 2000 ETF |
$265,92 | 2.8% | 0.0% | 0.0% | 4.1% | 3.0% | - | $631 802 | $100 060 001 | 0,01 | - | - |  |
||
| 56 |
 Johnson & Johnson |
$265,03 | 2.0% | 0.0% | 1.4% | 7.7% | 2.6% | - | $591 372 | $108 279 040 | 0,01 | - | - |  |
||
| 57 |
Alphabet Class A
|
$274,31 | 1.6% | 0.5% | 3.3% | 4.4% | 15.4% | $321 171 | $579 461 | $579 461 | 1,00 | - | - |  |
||
| 58 |
 Vanguard Total World |
$144,72 | 0.9% | 0.0% | 2.2% | 7.0% | 9.0% | - | $558 390 | $108 313 900 | 0,01 | - | - |  |
||
| 59 |
 Jersey Mike's Subs |
$19,85 | 17.4% | 0.0% | 0.0% | 0.1% | 18.0% | $27,85 | $541 921 | $541 921 | 1,00 | - | - |  |
||
| 60 |
 Cisco Systems |
$92,33 | 0.3% | 0.1% | 1.8% | 2.6% | 11.1% | $1 812,85 | $537 375 | $107 209 561 | 0,01 | - | - |  |
||
| 61 |
 Novo Nordisk |
$39,93 | 5.6% | 0.0% | 2.5% | 2.8% | 0.5% | $2,83 | $535 361 | $85 751 025 | 0,01 | - | - |  |
||
| 62 |
 UnitedHealth |
$333,61 | 0.6% | 0.0% | 1.0% | 17.4% | 22.4% | $6 091,22 | $519 129 | $128 649 625 | 0,00 | - | - |  |
||
| 63 |
 JPMorgan Chase |
$316,13 | 1.1% | 0.0% | 2.6% | 7.7% | 4.4% | $167,07 | $514 852 | $96 747 418 | 0,01 | - | - |  |
||
| 64 |
 State Street Energy Select Sector SPDR Fund |
$61,07 | 0.6% | 0.0% | 0.3% | 5.8% | 10.0% | - | $509 901 | $75 066 243 | 0,01 | - | - |  |
||
| 65 |
 DeFi Development Corp. |
$2,14 | 3.7% | 0.9% | 2.6% | 24.9% | 43.1% | $107 713 | $502 148 | $502 148 | 1,00 | $54 846,48 | $123 560 |  |
||
| 66 |
Apple
|
$350,83 | 1.7% | 0.1% | 2.4% | 1.6% | 0.8% | $524 681 | $487 331 | $487 331 | 1,00 | - | - |  |
||
| 67 |
 Salesforce |
$184,69 | 0.9% | 0.0% | 0.5% | 16.3% | 23.6% | - | $471 979 | $93 950 365 | 0,01 | - | - |  |
||
| 68 |
 Moderna |
$194,26 | 2.5% | 0.0% | 0.8% | 12.2% | 21.3% | - | $423 787 | $176 801 985 | 0,00 | - | - |  |
||
| 69 |
 Goldman Sachs |
$795,90 | 0.4% | 0.0% | 7.8% | 11.1% | 11.5% | - | $391 342 | $100 502 377 | 0,00 | - | - |  |
||
| 70 |
 Visa |
$387,51 | 4.3% | 0.0% | 1.2% | 6.4% | 3.6% | $57,94 | $388 740 | $119 084 499 | 0,00 | - | - |  |
||
| 71 |
 Procter & Gamble |
$168,91 | 0.3% | 0.0% | 0.1% | 0.2% | 0.0% | $1 781,87 | $359 836 | $118 900 043 | 0,00 | - | - |  |
||
| 72 |
 Pfizer |
$27,28 | 0.6% | 0.0% | 4.7% | 3.4% | 9.2% | $320 935 | $336 424 | $122 758 253 | 0,00 | - | - |  |
||
| 73 |
 PepsiCo |
$140,54 | 0.3% | 0.7% | 0.6% | 2.8% | 1.1% | $1 384,69 | $323 795 | $101 479 450 | 0,00 | - | - |  |
||
| 74 |
 AbbVie |
$284,69 | 0.5% | 0.0% | 0.0% | 3.0% | 0.1% | $1 911,98 | $321 835 | $123 756 589 | 0,00 | - | - |  |
||
| 75 |
 Fundrise Innovation Fund |
$18,52 | 32.8% | - | 13.0% | 2.6% | 21.8% | - | $319 799 | $52 835 090 | 0,01 | - | - |  |
||
| 76 |
 TON |
$2,43 | 1.9% | 0.0% | 10.3% | 13.8% | 13.8% | - | $287 461 | $93 896 691 | 0,00 | - | - |  |
||
| 77 |
 Global X Copper Miners ETF |
$57,85 | 1.4% | 0.0% | 4.0% | 17.2% | 26.3% | - | $287 388 | $68 093 138 | 0,00 | - | - |  |
||
| 78 |
 Uber |
$65,57 | 2.0% | 0.0% | 1.0% | 4.1% | 4.1% | $7,08 | $265 737 | $96 467 758 | 0,00 | - | - |  |
||
| 79 |
 iShares Core MSCI Emerging Markets ETF |
$67,27 | 0.8% | 0.0% | 1.1% | 8.7% | 10.6% | $335,94 | $243 752 | $243 752 | 1,00 | - | - |  |
||
| 80 |
 Walmart |
$127,34 | 0.6% | 0.0% | 0.1% | 1.0% | 4.7% | $113,61 | $242 494 | $128 594 865 | 0,00 | - | - |  |
||
| 81 |
Microsoft
|
$500,52 | 2.2% | 0.1% | 2.8% | 4.0% | 4.6% | $214 992 | $234 756 | $234 756 | 1,00 | - | - |  |
||
| 82 |
 Bank of America |
$46,30 | 2.0% | 0.0% | 2.6% | 8.7% | 8.4% | - | $229 950 | $92 195 681 | 0,00 | - | - |  |
||
| 83 |
 Oklo |
$23,42 | 15.6% | 0.0% | 0.0% | 0.5% | 13.4% | $19,80 | $229 647 | $70 293 535 | 0,00 | - | - | 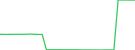 |
||
| 84 |
 abrdn Physical Platinum Shares ETF |
$11,89 | 0.9% | 0.0% | 1.3% | 12.3% | 18.8% | - | $229 119 | $68 246 631 | 0,00 | - | - |  |
||
| 85 |
 Pop Mart International |
$17,33 | 4.6% | 0.0% | 0.9% | 3.5% | 5.8% | $35 896,31 | $219 647 | $219 647 | 1,00 | - | - | 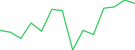 |
||
| 86 |
 Schwab International Equity ETF |
$25,77 | 2.2% | 0.0% | 1.0% | 3.7% | 5.5% | - | $213 106 | $213 106 | 1,00 | - | - |  |
||
| 87 |
Meta Platforms
|
$573,04 | 0.9% | 0.1% | 1.8% | 8.9% | 11.5% | $76 282,22 | $212 932 | $212 932 | 1,00 | - | - |  |
||
| 88 |
Taiwan Semiconductor Manufacturing - ADR
|
$329,60 | 0.4% | 0.0% | 22.1% | 22.1% | 22.1% | $606,10 | $212 925 | $212 925 | 1,00 | - | - | 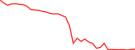 |
||
| 89 |
 PayPal |
$53,70 | 0.5% | 0.0% | 7.5% | 8.8% | 5.7% | - | $211 223 | $95 738 164 | 0,00 | - | - | 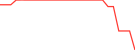 |
||
| 90 |
 Amber |
$0,9613 | 17.8% | 0.0% | 20.6% | 47.5% | 43.8% | $1 758,89 | $206 259 | $73 554 478 | 0,00 | - | - |  |
||
| 91 |
 Global X Uranium ETF |
$30,52 | 12.7% | - | 23.5% | 23.2% | 39.0% | - | $200 669 | $36 216 502 | 0,01 | - | - |  |
||
| 92 |
 Comcast |
$24,78 | 0.8% | 0.0% | 0.3% | 1.2% | 9.3% | $681,20 | $200 139 | $93 613 262 | 0,00 | - | - |  |
||
| 93 |
Strategy
|
$80,95 | 1.8% | 0.4% | 4.4% | 18.9% | 43.7% | $90 253,79 | $189 425 | $189 425 | 1,00 | - | - |  |
||
| 94 |
 Constellation Energy |
$244,70 | 1.3% | 0.0% | 6.3% | 11.1% | 8.8% | - | $186 008 | $60 296 129 | 0,00 | - | - |  |
||
| 95 |
 Merck |
$135,53 | 1.3% | 0.0% | 0.0% | 8.4% | 8.8% | - | $183 988 | $131 806 628 | 0,00 | - | - |  |
||
| 96 |
BitMine Immersion Technologies
|
$13,73 | 2.7% | 0.3% | 5.9% | 13.0% | 38.6% | $50 160,80 | $178 302 | $178 302 | 1,00 | - | - |  |
||
| 97 |
 Tencent - ADR |
$42,22 | 4.4% | 0.2% | 1.8% | 14.7% | 13.7% | $14 331,37 | $177 386 | $177 386 | 1,00 | - | - |  |
||
| 98 |
 Vida Global |
$0,5804 | 2.7% | 0.1% | 7.6% | 16.3% | 45.9% | $3 475,53 | $167 494 | $69 402 069 | 0,00 | - | - |  |
||
| 99 |
 abrdn Physical Palladium Shares ETF |
$16,29 | 0.3% | 0.0% | 0.3% | 10.3% | 17.9% | - | $166 337 | $62 287 388 | 0,00 | - | - |  |
||
| 100 |
 Accenture |
$224,15 | 1.3% | 0.0% | 1.0% | 10.0% | 13.2% | $1 543,72 | $164 278 | $103 980 876 | 0,00 | - | - |  |


About xStocks
Are you the issuer? Submit a request to keep your details up to date.
Issuance
Identity
Issuing Entity
Backed Assets (JE) Limited
The legal company that issues this token. This may differ from the brand name.
Domicile
🇯🇪 Jersey
The country where it's registered.
Issuance Framework
Where and under which rules this product is offered. Some products involve several countries' laws.
🇱🇮 Liechtenstein · FMA · EU Prospectus Regulation base prospectus, passported across the EEA
🇯🇪 Jersey · JFSC · Jersey issuer consents
🇺🇸 United States · none · not registered
Structure
Tokenization Model
What the token legally is: the real asset, an interest in an asset held for you, or the issuer's own contract that tracks the price.
Third-Party Synthetic
The token is the issuer's own note or derivative that tracks the price. No real asset is held for you.
Legal Instrument
The legal form of what you hold: a share, fund unit, note, derivative, or claim on physical commodity.
Debt Security
A note owed to you by the token issuer. You're effectively a lender, with returns tied to the asset's price.
Claim Against
Who your claim points to: the real asset's issuer, a fund, the physical commodity itself, or the company that issued the token.
RWA Token Issuer
You're a creditor or counterparty of the company that issued the token, not an owner of the asset.
Backing Type
What stands behind your token: assets held specifically for you, a shared pool, pledged collateral, or only the issuer's promise.
Collateralized
Assets are pledged to holders, enforced by a security agent if needed. Recovery is capped at the collateral.
Holder Rights
Voting
Whether you can vote at shareholder or fund meetings, and how.
None
No voting rights.
Dividend
Whether and how you receive dividends or income from the underlying asset.
Reinvested Rebase
Payouts are reinvested automatically. Your token balance or value grows instead of you receiving cash.
Corporate Actions
How events like stock splits or mergers affect your holding.
Rebase
Your holding is adjusted to reflect events like splits, but you don't take part as a shareholder.
Pre-emptive Subscription Rights
Whether you get first right to buy new shares when the company issues more.
None
You don't get first right to buy new shares.
Information Disclosure Rights
What information you're legally entitled to receive, and from whom.
Via Platform, No Inspection Rights
The platform publishes data like NAV or proof-of-reserves. You have no legal right to inspect the issuer's books.
Enforcement / Legal Rights
Who you can take legal action against to enforce your rights.
Against Issuing Entity or SPV
You can pursue the token issuer, fund or special-purpose company, but your reach stops there.
Residual Liquidation Claim
What you'd be entitled to if the issuer went bankrupt, and how you'd rank against other creditors.
Secured Creditor on Collateral
You have a claim on specific pledged collateral if the issuer fails. Recovery is capped at what it sells for.
Access
Redemption
Whether you can return the token to the issuer, what you'd get back (cash or the real asset), and whether ID checks apply.
Cash Only
You can redeem the token with the issuer for cash.
Redemption KYC Required
Yes
Whether you must verify your identity before redeeming with the issuer.
Open to US Persons
No
Whether US persons are allowed to hold or buy this product.
KYC Required
No
Whether you must verify your identity to hold or buy this product.
Sophisticated Investors Only
No
Whether only professional, accredited or qualified investors can hold this product.
Transferability
Whether you can send this token to other wallets freely, only to approved wallets, or not at all.
Open
Freely transferable on-chain. Sanctions screening or issuer freezes may still apply.
Source
Evidence
assets.backed.fi
Info based on issuer documents listed above. Refer to the source for full terms.
xStocks Statistics
24h Volume by Token
24h Perps Volume by Token
Volume
Trading volume of xStocks's tokens over time.
Perps Volume
Perps trading volume of xStocks's tokens over time.


 Nebo si ji prohlédněte v obchodech s aplikacemi


