





Portafogli
Aggiungi al nuovo portafoglio

Traccia
![]() ovunque tu sia
Ricevi aggiornamenti in tempo reale tramite notifiche push sull'app.

Apri l'App
Top Analytics monete per capitalizzazione di mercato
Oggi la capitalizzazione Analytics di mercato è $1,28 Miliardi, una variazione del 3.0% nelle ultime 24 ore.
In evidenza
$1.275.021.761
Cap. di mercato
2.3%

$107.394.681
Volume in 24 ore


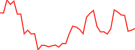
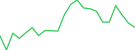
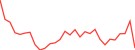
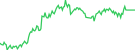
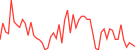
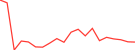
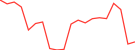
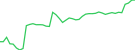
| # | Moneta | Prezzo | 1h | 24h | 7g | 30g | Volume in 24 ore | Cap. di mercato | FDV | Market Cap / FDV | Ultimi 7 giorni | ||
|---|---|---|---|---|---|---|---|---|---|---|---|---|---|
| 8466 |

RHTools
TOOLS
|
$0,00002651 | 1.2% | 0.3% | 15.8% | 61.3% | $63,20 | $26.506,59 | $26.506,59 | 1.0 |
|
||
| 8710 |

AInalyst
AIN
|
$0,00002356 | 1.3% | 0.6% | 18.6% | 31.7% | $64,41 | $23.558,50 | $23.558,50 | 1.0 |
|
||
| 8794 |

Tradescoop by Virtuals
SCOOP
|
$0,00002268 | 0.0% | 25.5% | 25.5% | 27.0% | $31,60 | $22.682,43 | $22.682,43 | 1.0 |
|
||
| 8973 |

Navigate
NVG8
|
$0,00008374 | 0.0% | 0.8% | 0.8% | 9.4% | $2,05 | $21.128,81 | $83.741,27 | 0.25231056655503403 |
|
||
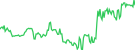
| 9020 |

ReVault
RVAULT
|
$0.062074 | 0.0% | 1.5% | 16.1% | 26.2% | $1,42 | $20.735,28 | $20.735,28 | 1.0 |
|
||
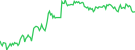
| 9172 |

opensvm.com
SVMAI
|
$0,00001955 | 0.0% | 17.8% | 17.8% | 33.0% | $5,62 | $19.545,55 | $19.545,55 | 1.0 |
|
||
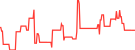
| 9174 |

Hyperbot
BOT
|
$0,0001552 | 0.0% | 4.0% | 39.3% | 36.9% | $63,57 | $19.533,36 | $155.232 | 0.125833333 |
|
||
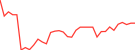
| 9208 |

Velvet AI
VELAI
|
$0,00001742 | 0.9% | 2.3% | 14.4% | 21.7% | $45,61 | $19.250,98 | $19.250,98 | 1.0 |
|
||
| 9327 |

Howl.fi
HOWL
|
$0,00001847 | 1.2% | 5.4% | 42.4% | 0.0% | $219,02 | $18.471,12 | $18.471,12 | 1.0 |
|
||
| 9340 |

Helio
HELIO
|
$0,00001993 | 2.4% | 15.0% | 13.3% | 32.5% | $63,28 | $18.383,26 | $18.383,26 | 1.0 |
|
||
| 9505 |

Oren
OREN
|
$0,00001867 | 3.9% | 11.7% | 26.0% | 0.0% | $4.591,36 | $17.162,09 | $17.162,09 | 1.0 |
|
||
| 9523 |

gemxbt
GEMXBT
|
$0,00001785 | 2.4% | 4.9% | 18.9% | 33.1% | $6,55 | $16.956,05 | $16.956,05 | 1.0 |
|
||
| 9533 |

Mind AI
MA
|
$0,00003717 | 0.0% | 0.0% | 6.3% | 43.9% | $7,21 | $16.844,46 | $18.585,62 | 0.9063165495639125 |
|
||
| 9638 |

Prometheus
PROMETHEUS
|
$0,00003217 | 0.0% | 25.3% | 25.3% | 5.7% | $5,78 | $16.085,22 | $32.172,93 | 0.4999614075370567 |
|
||
| 9696 |

UpScalp
UPSCALP
|
$0,00001763 | 2.4% | 2.6% | 8.6% | 35.6% | $10,16 | $15.814,75 | $17.631,01 | 0.8969851681456671 |
|
||
| 9762 |

ComputeBase
COMPUTE
|
$0.061523 | 0.0% | 0.3% | 0.2% | 10.5% | $6,30 | $15.230,32 | $15.230,32 | 1.0 |
|
||
| 9775 |

TetraScore
SCORE
|
$0,00001516 | 0.0% | 3.4% | 5.8% | 34.7% | $24,61 | $15.157,23 | $15.157,23 | 1.0 |
|
||
| 9854 |

Omnis Genesis by Virtuals
OMNI
|
$0,00001730 | 0.0% | 0.5% | 4.0% | 7.1% | $1,51 | $14.614,96 | $14.614,96 | 1.0 |
|
||
| 10098 |

SYLVI AGENT
SYLVIAI
|
$0,00001318 | 0.0% | 6.4% | 10.5% | 27.4% | $1,29 | $13.179,76 | $13.179,76 | 1.0 |
|
||
| 10163 |

Checkr
$CHECKR
|
$0.064599 | 0.0% | 2.4% | 14.6% | 34.1% | $5,36 | $12.865,40 | $44.382,52 | 0.28987530046836074 |
|
||
| 10211 |

FOCO
FOCO
|
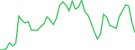
$0,00001264 | 0.0% | 3.0% | 97.9% | 0.0% | $96,08 | $12.635,73 | $12.635,73 | 1.0 |
|
||
| 10235 |

HooderScan
HOODER
|
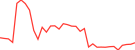
$0,00001675 | 0.0% | 49.2% | 92.6% | 70.6% | $1.062,53 | $12.560,66 | $16.747,55 | 0.75 |
|
||
| 10250 |

Melvin
MEL
|
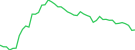
$0,00001249 | 0.0% | 4.5% | 30.9% | 51.7% | $134,38 | $12.490,40 | $12.490,40 | 1.0 |
|
||
| 10274 |

BelieveScreener
BSCREENER
|
$0,00001237 | 0.0% | 1.0% | 14.7% | 15.1% | $1,00000 | $12.367,35 | $12.367,35 | 1.0 |

|
||
| 10464 |

PATRIOT
PATRIOT
|
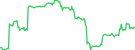
$0,00001152 | 1.3% | 0.9% | 13.7% | 32.1% | $4,26 | $11.521,07 | $11.521,07 | 1.0 |
|
||
| 10521 |

Wallitelli
WALLI
|
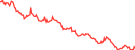
$0,00001129 | 0.0% | 25.2% | 47.4% | 97.5% | $580.383 | $11.291,22 | $11.291,22 | 1.0 |
|
||
| 10602 |

Anti Rug Agent
ANTIRUG
|
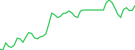
$0,00001097 | 2.4% | 4.7% | 19.7% | 31.8% | $82,69 | $10.965,76 | $10.965,76 | 1.0 |
|
||
| 10615 |

SocialCrab
SCRB
|
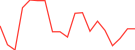
$0,00001089 | 0.0% | 6.7% | 4.9% | 23.5% | $211,62 | $10.888,71 | $10.888,71 | 1.0 |
|
||
| 10666 |

Generative Market eXplorer
AIGMX
|
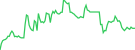
$0,00001071 | 0.0% | 0.7% | 17.2% | 35.6% | $1,64 | $10.705,22 | $10.705,22 | 1.0 |
|
||
| 10918 |

BubbleFlap
BFLAP
|
$0,00001082 | 1.1% | 0.6% | 11.1% | 22.7% | $1,85 | $9.777,05 | $9.777,05 | 1.0 |
|
||
| 11027 |

Deepnets
DNET
|
$0.059748 | 0.0% | 7.9% | 23.7% | 55.1% | $289,28 | $9.332,08 | $9.332,08 | 1.0 |
|
||
| 11109 |

Liquidum
LIDUM
|
$0.059045 | 0.0% | 29.2% | 29.2% | 32.9% | $2,78 | $9.044,88 | $9.044,88 | 1.0 |
|
||
| 11250 |

Strategic ETH Reserve
SΞR
|
$0,00008553 | 0.0% | 0.6% | 18.9% | 25.5% | $8,55 | $8.552,68 | $8.552,68 | 1.0 |

|
||
| 11392 |

Exodus AI
EXO
|
$0.058169 | 0.0% | 4.1% | 11.9% | 25.9% | $4,09 | $8.073,65 | $8.073,65 | 1.0 |
|
||
| 11482 |

Arcvein
ARCVEIN
|
$0.057810 | 0.0% | 3.0% | 25.6% | 0.0% | $216,76 | $7.809,81 | $7.809,81 | 1.0 |
|
||
| 11569 |

Trio ICM
TRIO
|
$0.057575 | 0.0% | 0.1% | 24.2% | 30.3% | $1,77 | $7.574,87 | $7.574,87 | 1.0 |
|
||
| 11686 |

Hoodwatch
WATCH
|
$0.057249 | 1.1% | 2.6% | 21.1% | 60.5% | $54,33 | $7.249,25 | $7.249,25 | 1.0 |
|
||
| 11746 |

BelievePad
BPAD
|
$0.057082 | 0.0% | 16.0% | 16.0% | 21.7% | $1,90 | $7.062,76 | $7.062,76 | 1.0 |
|
||
| 11817 |

PredicTools
PREDIC
|
$0.056863 | 2.4% | 4.5% | 15.0% | 33.3% | $15,31 | $6.860,20 | $6.860,20 | 1.0 |
|
||
| 12033 |

Chain-Fox
CFX
|
Acquista
|
$0.056336 | 0.0% | 0.7% | 8.2% | 13.3% | $2,08 | $6.334,84 | $6.334,84 | 1.0 |
|
|
| 12112 |

BOW
BOW
|
$0.057088 | 0.0% | 3.7% | 16.8% | 26.7% | $3,24 | $6.155,91 | $6.155,91 | 1.0 |
|
||
| 12168 |

Fable
FABLE
|
$0.056560 | 0.0% | 5.6% | 21.7% | 10.8% | $1,03 | $6.046,05 | $6.046,05 | 1.0 |
|
||
| 12216 |

VirtuBeauty by Virtuals
VBEA
|
$0.055950 | 0.0% | 5.0% | 17.8% | 31.3% | $4,77 | $5.950,23 | $5.950,23 | 1.0 |

|
||
| 12358 |

We Will Huddle
HUDDLE
|
$0.055725 | 0.0% | 5.2% | 13.5% | 25.9% | $1,64 | $5.673,41 | $5.673,41 | 1.0 |

|
||
| 12460 |

Ocula
OCULA
|
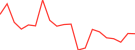
$0.055721 | 2.4% | 5.0% | 1.3% | 86.2% | $39,97 | $5.450,38 | $5.450,38 | 1.0 |
|
||
| 12498 |

AAAI_agent by Virtuals
AAAI
|
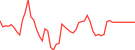
$0.055363 | 0.0% | 27.7% | 27.7% | 45.5% | $116,81 | $5.362,99 | $5.362,99 | 1.0 |
|
||
| 12752 |

Kyro Markets
KYRO
|
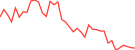
$0.054859 | 0.0% | 1.7% | 32.5% | 0.0% | $10,58 | $4.859,26 | $4.859,26 | 1.0 |
|
||
| 12831 |

toaster.trade
TOASTER
|
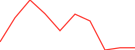
$0.055539 | 0.0% | 21.0% | 21.0% | 21.0% | $1,36 | $4.707,97 | $4.707,97 | 1.0 |
|
||
| 12948 |

Opus The Trencher
OPUS
|
$0.054626 | 0.0% | 0.8% | 20.1% | 37.6% | $0,9927 | $4.493,68 | $4.493,68 | 1.0 |
|
||
| 13109 |

Degen Social Media
DEGEN
|
$0.054233 | 0.0% | 1.1% | 1.1% | 15.5% | $183,37 | $4.227,19 | $4.227,19 | 1.0 |
|
||
| 13136 |

RiceLabs
RICE
|
$0.054191 | 0.0% | 3.3% | 3.3% | 13.4% | $1,11 | $4.191,17 | $4.191,17 | 1.0 |
|
||
| 13382 |

RobinSight
SIGHT
|
$0.053803 | 1.2% | 11.0% | 19.9% | 34.2% | $12,09 | $3.803,21 | $3.803,21 | 1.0 |
|
||
| 13387 |

XScouter AI
XSAI
|
$0,007581 | 0.0% | 0.0% | 2.4% | 13.1% | $3,48 | $3.790,31 | $3.790,31 | 1.0 |
|
||
| 13396 |

INVARA Core
INVR
|
$0.054193 | 0.5% | 0.9% | 22.6% | 0.0% | $48,05 | $3.779,74 | $4.192,67 | 0.9015099837412969 |
|
||
| 13434 |

Julia Swarm Syndicate
JSS
|
$0.053858 | 0.0% | 3.2% | 18.6% | 25.8% | $1,85 | $3.720,44 | $3.720,44 | 1.0 |

|
||
| 13452 |

Sounder Liquidity
SOUNDER
|
$0.053681 | 0.0% | 0.6% | 21.9% | 70.5% | $2,03 | $3.680,70 | $3.680,70 | 1.0 |
|
||
| 13621 |

DexChart
CHART
|
$0.053445 | 0.0% | 4.0% | 1.3% | 18.1% | $2,63 | $3.444,95 | $3.444,95 | 1.0 |
|
||
| 13638 |

Thesis AI
THESIS
|
$0.053420 | 1.6% | 0.1% | 16.7% | 96.7% | $11,12 | $3.420,14 | $3.420,14 | 1.0 |
|
||
| 13819 |

HUME MARKETS
HUME
|
$0.053164 | 0.4% | 11.0% | 13.4% | 82.1% | $26,11 | $3.163,55 | $3.163,55 | 1.0 |
|
||
| 13823 |

0xsim by Virtuals
SAGE
|
$0.053161 | 0.0% | 0.8% | 16.5% | 35.7% | $2,00 | $3.160,64 | $3.160,64 | 1.0 |
|
||
| 13875 |

AstheraFi
ASTHER
|
$0.053107 | 0.0% | 7.8% | 7.8% | 12.4% | $8,06 | $3.107,11 | $3.107,11 | 1.0 |
|
||
| 13943 |

Grail
GRAIL
|
$0.053352 | 0.0% | 7.4% | 1.4% | 62.6% | $3,88 | $3.021,79 | $3.021,79 | 1.0 |
|
||
| 14023 |

Super Intelligent Identity
SIMD
|
$0.052930 | 0.0% | 0.3% | 19.2% | 53.9% | $1,45 | $2.930,14 | $2.930,14 | 1.0 |
|
||
| 14183 |

Quanta
QNTA
|
$0.052794 | 0.0% | 4.1% | 9.6% | 23.1% | $1,49 | $2.737,97 | $2.737,97 | 1.0 |
|
||
| 14187 |

Lashi
LASHI
|
$0.052735 | 0.0% | 6.3% | 6.3% | 27.5% | $1,50 | $2.734,94 | $2.734,94 | 1.0 |
|
||
| 14359 |

BubbleLabs
BUBBLE
|
$0.052632 | 0.0% | 5.9% | 5.9% | 5.9% | $3,64 | $2.552,76 | $2.552,76 | 1.0 |
|
||
| 14540 |

Glint
$GLINT
|
$0.073346 | 0.0% | 30.1% | 46.3% | 0.0% | $401,86 | $2.342,52 | $3.346,46 | 0.7000000000000001 |

|
||
| 14545 |

MCAPS
MCAPS
|
$0.052337 | 0.0% | 7.4% | 18.4% | 99.1% | $36,69 | $2.336,75 | $2.336,75 | 1.0 |
|
||
| 14585 |

Raindrop
RAIN
|
Acquista
|
$0.052272 | 0.0% | 2.5% | 11.7% | 24.6% | $2,26 | $2.271,28 | $2.271,28 | 1.0 |
|
|
| 14591 |

SWARM ENGINE
SWARM
|
$0.052280 | 0.0% | 0.4% | 14.3% | 87.3% | $1,93 | $2.263,97 | $2.263,97 | 1.0 |
|
||
| 14672 |

Lens
LENS
|
$0.052195 | 0.0% | 7.6% | 8.2% | 73.3% | $39,12 | $2.154,83 | $2.194,48 | 0.981932825344961 |
|
||
| 14717 |

sinex
SINX
|
$0.061206 | 0.0% | 3.4% | 3.4% | 31.2% | $1,03 | $2.082,37 | $2.082,37 | 1.0 |
|
||
| 14902 |

Alpha Lens X
ALPHAX
|
$0.051829 | 0.0% | 21.0% | 21.0% | 21.0% | $4,58 | $1.759,76 | $1.759,76 | 1.0 |
|
||

KROWN
KRW
|
$0.051880 | 1.2% | 0.0% | 5.8% | 44.8% | $44,74 | - | $18.802,64 |
|
||||

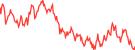
Ness Lab
NESS
|
$0,001490 | 0.7% | 0.3% | 5.9% | 39.8% | $18.670,99 | - | - |
|
||||

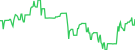
Sypool
SYP
|
$0,00006724 | 1.0% | 1.7% | 9.5% | 14.6% | $52,22 | - | $67.236,83 |
|
||||

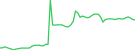
Pullix
PLX
|
$0,0006227 | 0.0% | 3.3% | 15.4% | 19.2% | $2,11 | - | $124.539 |
|
||||

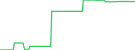
Bitcoin Silver AI
BSAI
|
$1.650,93 | 0.0% | 1.3% | 1.0% | 13.5% | $218.701 | - | $1.650.929.542.586 |
|
||||

Centcex
CENX
|
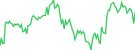
$0,00005526 | 0.3% | 0.4% | 12.3% | 17.8% | $39,79 | - | $552.629 |
|
||||

AXiS ALiVE
AXIS
|
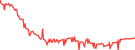
$292,65 | 0.6% | 0.9% | 0.4% | 2.1% | $296,84 | - | $292.647.354 |
|
||||

XTTA
XTTA
|
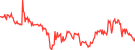
$0,005438 | 0.0% | 0.5% | 30.5% | 55.4% | $740,10 | - | $1.737.910 |
|
||||

Reflecto
RTO
|
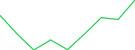
$0.096892 | 0.0% | 1.4% | 5.4% | 16.3% | $47,49 | - | $689.150 |
|
||||

Inery
$INR
|
$0,0004408 | 0.0% | 1.2% | 1.2% | 2.3% | $1,98 | - | $352.651 |
|
||||

DataPort Navigator by Virtuals
PORT
|
$0,00001893 | 0.0% | 4.0% | 20.4% | 40.9% | $1,69 | - | $18.932,84 |
|
||||

AltsDaddy
DDY
|
$0,00 | - | - | - | - | - | - | - |

|
||||

Trading Views
TRADINGVIEWS
|
$0,00 | - | - | - | - | - | - | - |

|
||||

AlphaRadarX
ARX
|
$0,00 | - | - | - | - | - | - | - |

|
||||

Dm.fun
FUN
|
$0,00 | - | - | - | - | - | - | - |

|
||||

Zeno Divergent [OLD]
ZENO
|
$0.051709 | 0.0% | 1.8% | 21.5% | 95.1% | $3,69 | - | $1.665,89 |
|
||||

ArexAI
ARXAI
|
$0,00 | - | - | - | - | - | - | - |

|
||||

elyscan
ELYSCAN
|
$0,00 | - | - | - | - | - | - | - |

|
||||

EVRITHNG
EVRI
|
$0,0004903 | 1.1% | 0.6% | 77.8% | 0.0% | $12,50 | - | $10.273,74 |
|
||||

FINDEXY
FINDEXY
|
$3,00 | 0.0% | 0.0% | 0.0% | 0.0% | $2.162,60 | - | $62.900.869.945 |
|
||||
Risultati da 101 a 193 di 193
Righe
Grafico della capitalizzazione di mercato delle principali valute di Analytics
Il grafico seguente mostra la capitalizzazione di mercato e la dominance della principali valute di Analytics, tra cui Pyth Network, The Graph, SoSoValue e altre, in un determinato periodo di tempo.
Grafico delle performance delle principali valute di Analytics
Il grafico seguente mostra le performance relative delle principali valute di Analytics nel tempo, evidenziando guadagni e perdite percentuali in termini di prezzo di mercato in diversi periodi di tempo.




 Oppure dai un'occhiata nell'app store


