





Portfeliai
Pridėti į naują portfelį


xStocks
$65,858M
31.2%
24 val. prekybos apimtis
🆕
New Listings


xStocks Tokenized Assets
| # | Coin | RWA | Kaina | Price Diff vs RWA | 1h % | 24 val. % | 7 d. % | 30 d. % | 24h Volume | Rink. kap. | FDV | Market Cap / FDV | Neterminuotų sandorių 24 h apimtis | Neterminuotų sandorių 24 h AP | Pastarąsias 7d | |
|---|---|---|---|---|---|---|---|---|---|---|---|---|---|---|---|---|
| 1 |
 Strategy PP Variable xStock
STRCX |
 Strategy PP Variable |
$108,99 | 9.7% | 0.5% | 0.3% | 0.4% | 1.7% | $465 467 | $121 710 429 | $323 331 928 | 0,38 | - | - |  |
|
| 2 |
 Circle xStock
CRCLX |
 Circle Internet Group |
$57,90 | 0.0% | 0.3% | 0.8% | 11.7% | 29.8% | $4 835 275 | $104 334 880 | $249 180 550 | 0,42 | $10 605 457 | $2 205 609 |  |
|
| 3 |
 MicroStrategy xStock
MSTRX |
 Strategy |
$102,67 | 0.0% | 0.6% | 3.4% | 17.4% | 25.0% | $1 557 128 | $102 507 727 | $203 732 279 | 0,50 | $417 386 | $2 188 719 |  |
|
| 4 |
 NVIDIA xStock
NVDAX |
 Nvidia |
$160,39 | 0.1% | 1.4% | 0.1% | 10.4% | 25.4% | $17 190 313 | $94 382 219 | $243 150 389 | 0,39 | $178 588 460 | $6 733 104 |  |
|
| 5 |
 SpaceX xStock
SPCXX |
 SpaceX |
$139,76 | 0.2% | 0.4% | 1.7% | 3.0% | 4.0% | $4 117 656 | $81 199 033 | $239 039 581 | 0,34 | - | - |  |
|
| 6 |
 SP500 xStock
SPYX |
 SPDR S&P 500 ETF Trust |
$756,16 | 0.6% | 0.1% | 0.3% | 1.7% | 1.3% | $2 601 156 | $75 020 519 | $212 316 838 | 0,35 | $844 026 | $2 919 402 |  |
|
| 7 |
 Nasdaq xStock
QQQX |
 Invesco QQQ ETF |
$674,36 | 0.1% | 0.2% | 0.3% | 2.4% | 5.3% | $926 103 | $73 691 017 | $216 009 064 | 0,34 | $573 415 | $1 582 244 |  |
|
| 8 |
 Tesla xStock
TSLAX |
 Tesla |
$384,54 | 0.0% | 0.1% | 0.2% | 7.0% | 8.9% | $3 709 009 | $68 237 623 | $224 693 956 | 0,30 | $757 311 | $794 347 |  |
|
| 9 |
 Alphabet xStock
GOOGLX |
 Alphabet Class A |
$295,05 | 0.0% | 0.3% | 1.1% | 2.4% | 13.4% | $1 719 092 | $66 828 871 | $189 135 579 | 0,35 | $54 554 510 | $2 715 685 |  |
|
| 10 |
 Intel xStock
INTCX |
 Intel |
$56,95 | 0.1% | 0.8% | 1.1% | 2.5% | 36.5% | $91 587,12 | $26 867 137 | $136 838 818 | 0,20 | $157 849 | $326 030 |  |
|
| 11 |
 Sandisk Corporation xStock
SNDKX |
 SanDisk |
$839,64 | 0.6% | 0.8% | 1.4% | 3.7% | 35.1% | $151 575 | $23 714 064 | $90 053 262 | 0,26 | - | - |  |
|
| 12 |
 Backed IB01 $ Treasury Bond 0-1yr
BIB01 |
 iShares $ Treasury Bond 0-1yr UCITS ETF |
$121,80 | 0.7% | - | 0.0% | 0.0% | 0.2% | - | $18 960 097 | $18 960 097 | 1,00 | - | - |  |
|
| 13 |
 Apple xStock
AAPLX |
 Apple |
$359,28 | 0.3% | 0.4% | 0.6% | 3.8% | 4.5% | $2 834 104 | $12 549 843 | $239 570 603 | 0,05 | $478 157 | $5 224 626 |  |
|
| 14 |
 Coinbase xStock
COINX |
 Coinbase |
$119,44 | 0.1% | 0.6% | 0.6% | 8.7% | 31.1% | $2 536 888 | $11 289 935 | $108 039 534 | 0,10 | $29 169 846 | $9 461 515 |  |
|
| 15 |
 Gold xStock
GLDX |
 SPDR Gold Shares |
$353,26 | 0.0% | 0.0% | 0.6% | 5.8% | 7.4% | $2 276 988 | $10 477 724 | $125 616 748 | 0,08 | $24 952,84 | $939 628 |  |
|
| 16 |
 Meta xStock
METAX |
 Meta Platforms |
$636,67 | 0.2% | 0.0% | 0.2% | 3.4% | 10.1% | $1 758 380 | $10 311 699 | $142 041 713 | 0,07 | $6 782 214 | $7 827 622 |  |
|
| 17 |
 Amazon xStock
AMZNX |
 Amazon |
$265,11 | 0.0% | 0.3% | 0.9% | 1.3% | 6.2% | $2 268 859 | $9 761 788 | $147 360 000 | 0,07 | $7 878 332 | $900 763 |  |
|
| 18 |
 SK Hynix xStock
SKHYX |
 SK Hynix - ADR |
$125,03 | 0.0% | 1.1% | 3.1% | 0.7% | 9.1% | $189 875 | $9 155 212 | $73 869 935 | 0,12 | - | - |  |
|
| 19 |
 Robinhood xStock
HOODX |
 Robinhood Markets |
$74,09 | 0.1% | 0.6% | 0.4% | 7.0% | 25.0% | $2 308 888 | $8 437 950 | $152 108 515 | 0,06 | $3 172 608 | $628 380 |  |
|
| 20 |
 Microsoft xStock
MSFTX |
 Microsoft |
$529,36 | 0.3% | 0.2% | 1.4% | 1.7% | 0.2% | $404 507 | $7 881 827 | $159 657 115 | 0,05 | - | - |  |
|
| 21 |
 Wrapped SP500 xStock
WSPYX |
SPDR S&P 500 ETF Trust
|
$757,43 | 0.8% | 0.0% | 0.4% | 1.9% | 1.1% | $965 931 | $7 204 608 | $7 204 608 | 1,00 | - | - | 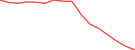 |
|
| 22 |
 Broadcom xStock
AVGOX |
 Broadcom |
$336,44 | 0.3% | 0.5% | 0.6% | 13.2% | 1.2% | $195 364 | $6 960 528 | $96 995 390 | 0,07 | $6 177 701 | $61 866,06 |  |
|
| 23 |
 AMD xStock
AMDX |
 Advanced Micro Devices |
$509,78 | 0.0% | 1.0% | 1.8% | 12.7% | 3.5% | $60 230,33 | $6 587 814 | $189 260 962 | 0,03 | - | - |  |
|
| 24 |
 TQQQ xStock
TQQQX |
 ProShares UltraPro QQQ |
$56,29 | 0.4% | 0.0% | 0.6% | 8.3% | 17.4% | $13 454,15 | $6 557 145 | $140 441 027 | 0,05 | $5 047 372 | $6 821 234 |  |
|
| 25 |
 Wrapped Nasdaq xStock
WQQQX |
Invesco QQQ ETF
|
$675,58 | 0.3% | 0.2% | 0.3% | 2.6% | 5.0% | $1 317 710 | $5 468 558 | $5 468 558 | 1,00 | - | - | 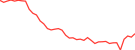 |
|
| 26 |
 TSMC xStock
TSMX |
 Taiwan Semiconductor Manufacturing - ADR |
$384,33 | 0.9% | 0.5% | 3.6% | 0.3% | 7.8% | $1 953,83 | $5 412 446 | $101 850 695 | 0,05 | - | - |  |
|
| 27 |
 Marvell xStock
MRVLX |
 Marvell Technology |
$149,74 | 0.2% | 0.7% | 3.1% | 9.9% | 34.1% | $9 336,18 | $5 252 910 | $167 593 274 | 0,03 | - | - |  |
|
| 28 |
 Oracle xStock
ORCLX |
 Oracle |
$124,19 | 1.7% | 0.0% | 0.3% | 7.8% | 3.2% | $711,51 | $4 645 786 | $79 263 456 | 0,06 | $6 498,86 | $568 772 |  |
|
| 29 |
 Bitmine xStock
BMNRX |
 BitMine Immersion Technologies |
$16,40 | 0.7% | 0.7% | 4.5% | 7.8% | 27.1% | $4 416,33 | $3 764 099 | $68 457 774 | 0,05 | - | - |  |
|
| 30 |
 Palantir xStock
PLTRX |
 Palantir Technologies |
$165,92 | 0.4% | 0.3% | 1.7% | 3.6% | 9.9% | $108 025 | $2 806 990 | $171 152 220 | 0,02 | $13 047,42 | $8 894,70 |  |
|
| 31 |
 KRAQ xStock
KRAQX |
 KRAQ |
$41,43 | 312.6% | - | 306.5% | 306.5% | 315.1% | - | $2 698 373 | $309 682 403 | 0,01 | - | - |  |
|
| 32 |
 Wrapped NVIDIA xStock
WNVDAX |
Nvidia
|
$160,63 | 0.3% | 1.4% | 0.1% | 10.5% | 25.4% | $2 730 939 | $2 567 346 | $2 567 346 | 1,00 | - | - |  |
|
| 33 |
 Backed IBTA $ Treasury Bond 1-3yr
BIBTA |
 iShares $ Treasury Bond 1-3yr UCITS ETF |
$5,95 | 0.4% | - | 0.1% | 0.3% | 0.5% | - | $2 463 937 | $2 463 937 | 1,00 | - | - |  |
|
| 34 |
 McDonald's xStock
MCDX |
 McDonald's |
$270,82 | 1.0% | 0.2% | 1.8% | 1.2% | 9.9% | $637 806 | $2 443 252 | $90 964 744 | 0,03 | $205 412 | $692 797 |  |
|
| 35 |
 Netflix xStock
NFLXX |
 Netflix |
$62,66 | 0.2% | 0.6% | 2.1% | 1.5% | 11.1% | $6 239,43 | $2 311 583 | $222 449 702 | 0,01 | - | - |  |
|
| 36 |
 Wrapped SpaceX xStock
WSPCXX |
SpaceX
|
$139,91 | 0.1% | 0.7% | 1.4% | 2.7% | 4.3% | $528 552 | $2 294 934 | $2 294 934 | 1,00 | - | - |  |
|
| 37 |
 Berkshire Hathaway xStock
BRK.BX |
 Berkshire Hathaway |
$595,68 | 0.1% | 0.2% | 1.1% | 3.8% | 12.2% | $22 891,53 | $2 292 109 | $118 384 316 | 0,02 | - | - |  |
|
| 38 |
 Gamestop xStock
GMEX |
 GameStop |
$25,65 | 0.1% | 0.5% | 1.1% | 4.2% | 4.6% | $223 970 | $2 060 698 | $126 394 031 | 0,02 | - | - |  |
|
| 39 |
 Wrapped Tesla xStock
WTSLAX |
Tesla
|
$384,47 | 0.1% | 0.2% | 0.3% | 6.9% | 8.7% | $564 868 | $1 912 647 | $1 912 647 | 1,00 | - | - |  |
|
| 40 |
 Vanguard xStock
VTIX |
 Vanguard Total Stock Market ETF |
$367,13 | 0.9% | 0.2% | 0.4% | 1.1% | 3.5% | $4 873,12 | $1 791 305 | $133 143 053 | 0,01 | - | - |  |
|
| 41 |
 MARA xStock
MARAX |
 MARA Holdings |
$6,61 | 1.1% | 0.0% | 2.7% | 5.9% | 31.7% | $22 808,75 | $1 575 857 | $79 705 228 | 0,02 | - | - |  |
|
| 42 |
 iShares Silver Trust xStock
SLVX |
 iShares Silver Trust |
$43,01 | 0.6% | 0.0% | 1.5% | 10.4% | 16.6% | $1 542,15 | $1 391 647 | $60 471 515 | 0,02 | - | - |  |
|
| 43 |
 Eli Lilly xStock
LLYX |
 Eli Lilly |
$1 440,30 | 1.3% | 0.1% | 0.9% | 4.8% | 14.5% | $7 512,12 | $1 339 994 | $166 068 609 | 0,01 | - | - |  |
|
| 44 |
 ASML xStock
ASMLX |
 ASML Holding NV |
$1 449,73 | 0.3% | 0.0% | 2.9% | 3.5% | 12.1% | $992,55 | $1 217 022 | $110 470 443 | 0,01 | - | - |  |
|
| 45 |
 Coca-Cola xStock
KOX |
 Coca-Cola |
$100,85 | 0.8% | 0.2% | 0.3% | 3.3% | 6.2% | $21 056,12 | $1 165 584 | $147 588 131 | 0,01 | $259 979 | $34 100,58 |  |
|
| 46 |
 AppLovin xStock
APPX |
 AppLovin |
$408,57 | 0.2% | 0.0% | 1.3% | 6.0% | 53.5% | $12,89 | $1 096 403 | $116 574 925 | 0,01 | - | - |  |
|
| 47 |
 International Business Machines xStock
IBMX |
 IBM |
$245,33 | 0.8% | 0.0% | 0.8% | 1.2% | 5.8% | $3 327,00 | $1 088 139 | $89 260 727 | 0,01 | - | - |  |
|
| 48 |
 TBLL xStock
TBLLX |
 Invesco Short Term Treasury ETF |
$105,30 | 0.4% | - | 0.7% | 0.2% | 0.2% | - | $880 061 | $622 663 033 | 0,00 | - | - |  |
|
| 49 |
 Wrapped Circle xStock
WCRCLX |
Circle Internet Group
|
$57,92 | 0.1% | 0.2% | 0.3% | 11.6% | 29.8% | $376 032 | $848 214 | $848 214 | 1,00 | - | - |  |
|
| 50 |
 Chevron xStock
CVXX |
 Chevron |
$224,83 | 2.1% | 0.0% | 2.2% | 5.6% | 4.2% | $843,13 | $836 381 | $136 397 459 | 0,01 | - | - |  |
|
| 51 |
 Wrapped VanEck Semiconductor ETF xStock
WSMHX |
 VanEck Semiconductor ETF |
$473,58 | 0.4% | 1.3% | 1.1% | - | - | $22 157,42 | $824 932 | $824 932 | 1,00 | - | - | 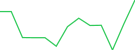 |
|
| 52 |
 CrowdStrike xStock
CRWDX |
 CrowdStrike |
$223,76 | 0.6% | 0.0% | 2.8% | 0.6% | 1.5% | $649,63 | $797 981 | $207 778 642 | 0,00 | - | - |  |
|
| 53 |
 Wrapped SK hynix xStock
WSKHYX |
SK Hynix - ADR
|
$125,28 | 0.2% | 0.9% | 2.6% | 1.3% | 9.1% | $79 041,19 | $777 635 | $777 635 | 1,00 | - | - |  |
|
| 54 |
 Wrapped Micron Technology xStock
WMUX |
 Micron Technology |
$740,53 | 0.1% | 1.0% | 1.8% | - | - | $92 891,00 | $736 980 | $736 980 | 1,00 | - | - | 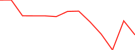 |
|
| 55 |
 Exxon Mobil xStock
XOMX |
 Exxon Mobil |
$174,51 | 2.6% | 0.0% | 0.9% | 2.2% | 1.8% | $671,23 | $694 213 | $136 361 261 | 0,01 | - | - |  |
|
| 56 |
 Russell 2000 xStock
IWMX |
 iShares Russell 2000 ETF |
$277,28 | 0.3% | - | 1.5% | 0.9% | 1.2% | - | $658 734 | $104 332 075 | 0,01 | - | - |  |
|
| 57 |
 DFDV xStock
DFDVX |
 DeFi Development Corp. |
$2,88 | 1.7% | 2.8% | 2.7% | 8.5% | 22.9% | $73 120,42 | $644 631 | $644 631 | 1,00 | $45 699,89 | $162 326 |  |
|
| 58 |
 Johnson & Johnson xStock
JNJX |
 Johnson & Johnson |
$288,17 | 0.3% | 0.0% | 0.3% | 1.1% | 12.7% | $781,88 | $640 325 | $117 734 325 | 0,01 | - | - |  |
|
| 59 |
 UnitedHealth xStock
UNHX |
 UnitedHealth |
$403,66 | 1.3% | 0.0% | 0.1% | 1.9% | 0.6% | $4 232,25 | $606 736 | $151 223 371 | 0,00 | - | - |  |
|
| 60 |
 Vanguard Total World xStock
VTX |
 Vanguard Total World |
$155,68 | 0.6% | - | 0.0% | 1.7% | 2.1% | - | $594 135 | $116 513 160 | 0,01 | - | - |  |
|
| 61 |
 JPMorgan Chase xStock
JPMX |
 JPMorgan Chase |
$352,45 | 1.5% | 0.0% | 1.2% | 4.0% | 4.7% | $294,97 | $573 889 | $107 862 097 | 0,01 | - | - |  |
|
| 62 |
 Novo Nordisk xStock
NVOX |
 Novo Nordisk |
$41,83 | 1.0% | 0.0% | 1.8% | 3.4% | 6.6% | $422,13 | $556 059 | $89 811 689 | 0,01 | - | - |  |
|
| 63 |
 Cisco xStock
CSCOX |
 Cisco Systems |
$94,83 | 0.2% | 0.7% | 0.9% | 1.2% | 11.5% | $4 071,13 | $551 941 | $108 097 961 | 0,01 | - | - |  |
|
| 64 |
 Energy Select Sector SPDR Fund xStock
XLEX |
 State Street Energy Select Sector SPDR Fund |
$64,84 | 0.3% | - | 2.7% | 4.3% | 3.7% | - | $541 413 | $79 705 415 | 0,01 | - | - |  |
|
| 65 |
 Salesforce xStock
CRMX |
 Salesforce |
$213,79 | 2.3% | 0.0% | 3.2% | 1.5% | 12.0% | $4,22 | $537 193 | $106 496 066 | 0,01 | - | - |  |
|
| 66 |
 Jersey Mike's Subs xStock
JMKEX |
 Jersey Mike's Subs |
$19,84 | 2.0% | - | 17.9% | 17.9% | 20.3% | - | $502 721 | $502 721 | 1,00 | - | - |  |
|
| 67 |
 TON xStock
TONXX |
 TON |
$2,82 | 11.7% | - | 0.0% | 3.8% | 23.1% | - | $491 640 | $104 262 497 | 0,00 | - | - |  |
|
| 68 |
 Moderna xStock
MRNAX |
 Moderna |
$221,27 | 0.5% | - | 4.3% | 13.3% | 2.0% | - | $465 123 | $201 387 657 | 0,00 | - | - |  |
|
| 69 |
 Goldman Sachs xStock
GSX |
 Goldman Sachs |
$891,64 | 2.2% | 0.6% | 0.4% | 4.3% | 1.0% | $237,94 | $420 121 | $112 592 088 | 0,00 | - | - |  |
|
| 70 |
 Amber xStock
AMBRX |
 Amber |
$1,85 | 3.7% | 0.0% | 1.1% | 16.3% | 5.1% | $1 803,47 | $397 059 | $105 253 304 | 0,00 | - | - |  |
|
| 71 |
 Visa xStock
VX |
 Visa |
$398,21 | 7.3% | 0.4% | 6.7% | 4.3% | 0.7% | $99,21 | $396 572 | $122 371 877 | 0,00 | - | - |  |
|
| 72 |
 Pfizer xStock
PFEX |
 Pfizer |
$30,31 | 4.2% | 0.0% | 6.7% | 2.8% | 3.5% | $357 770 | $384 759 | $136 361 542 | 0,00 | - | - |  |
|
| 73 |
 Procter & Gamble xStock
PGX |
 Procter & Gamble |
$170,12 | 0.5% | 0.1% | 1.0% | 1.6% | 7.4% | $6 823,33 | $362 484 | $119 755 151 | 0,00 | - | - |  |
|
| 74 |
 PepsiCo xStock
PEPX |
 PepsiCo |
$146,35 | 0.1% | 0.2% | 2.1% | 2.9% | 12.2% | $4 630,24 | $355 091 | $105 677 911 | 0,00 | - | - |  |
|
| 75 |
 Wrapped Alphabet xStock
WGOOGLX |
Alphabet Class A
|
$294,98 | 0.0% | 0.4% | 1.2% | 2.3% | 13.2% | $209 769 | $341 973 | $341 973 | 1,00 | - | - |  |
|
| 76 |
 AbbVie xStock
ABBVX |
 AbbVie |
$294,87 | 0.5% | 0.6% | 2.2% | 0.8% | 4.0% | $7 332,53 | $333 295 | $128 181 112 | 0,00 | - | - |  |
|
| 77 |
 Global X Copper Miners xStock
COPXX |
 Global X Copper Miners ETF |
$67,43 | 0.9% | 0.0% | 3.5% | 6.4% | 15.9% | $553,36 | $319 708 | $72 699 633 | 0,00 | - | - |  |
|
| 78 |
 Walmart xStock
WMTX |
 Walmart |
$129,41 | 0.1% | 0.0% | 2.9% | 1.8% | 8.6% | $574,04 | $282 207 | $130 691 415 | 0,00 | - | - |  |
|
| 79 |
 Fundrise Innovation Fund, LLC xStock
VCXX |
 Fundrise Innovation Fund |
$19,01 | 15.4% | - | 0.0% | 10.8% | 151.9% | - | $269 720 | $52 124 802 | 0,01 | - | - |  |
|
| 80 |
 Uber xStock
UBERX |
 Uber |
$73,60 | 6.3% | 1.1% | 8.3% | 7.1% | 0.8% | $148,67 | $267 766 | $108 286 824 | 0,00 | - | - |  |
|
| 81 |
 Bank of America xStock
BACX |
 Bank of America |
$52,92 | 3.5% | 0.0% | 4.3% | 5.7% | 2.7% | $5,80 | $263 222 | $105 386 991 | 0,00 | - | - |  |
|
| 82 |
 Core MSCI Emerging Markets xStock
IEMGX |
 iShares Core MSCI Emerging Markets ETF |
$73,71 | 0.4% | - | 1.8% | 1.3% | 6.6% | - | $255 884 | $255 884 | 1,00 | - | - |  |
|
| 83 |
 Wrapped Pop Mart International xStock
WPOPMTX |
 Pop Mart International |
$18,24 | 0.7% | 0.1% | 1.9% | 0.3% | 0.1% | $29 265,17 | $253 566 | $253 566 | 1,00 | - | - |  |
|
| 84 |
 Wrapped MicroStrategy xStock
WMSTRX |
Strategy
|
$102,65 | 0.0% | 0.5% | 3.0% | 17.3% | 25.0% | $206 851 | $251 426 | $251 426 | 1,00 | - | - |  |
|
| 85 |
 abrdn Physical Platinum Shares xStock
PPLTX |
 abrdn Physical Platinum Shares ETF |
$13,18 | 0.2% | 0.0% | 2.8% | 4.3% | 10.8% | $316,41 | $242 887 | $69 039 636 | 0,00 | - | - |  |
|
| 86 |
 Wrapped Microsoft xStock
WMSFTX |
Microsoft
|
$530,29 | 0.5% | 0.2% | 1.6% | 1.6% | 0.3% | $191 817 | $234 165 | $234 165 | 1,00 | - | - |  |
|
| 87 |
 PayPal xStock
PYPLX |
 PayPal |
$58,88 | 1.1% | - | 0.3% | 0.5% | 4.8% | - | $231 585 | $104 983 004 | 0,00 | - | - |  |
|
| 88 |
 Wrapped Meta xStock
WMETAX |
Meta Platforms
|
$637,64 | 0.3% | 0.0% | 0.4% | 3.5% | 10.2% | $117 214 | $227 265 | $227 265 | 1,00 | - | - |  |
|
| 89 |
 Mastercard xStock
MAX |
 Mastercard |
$663,34 | 0.3% | 1.6% | 1.8% | 1.9% | 9.9% | $5 603,24 | $213 749 | $129 385 002 | 0,00 | - | - |  |
|
| 90 |
 Oklo xStock
OKLOX |
 Oklo |
$23,53 | 2.4% | - | 11.0% | 0.3% | 28.3% | - | $212 734 | $68 290 421 | 0,00 | - | - |  |
|
| 91 |
 Wrapped Apple xStock
WAAPLX |
Apple
|
$358,87 | 0.2% | 0.1% | 0.4% | 3.8% | 4.5% | $40 118,57 | $212 636 | $212 636 | 1,00 | - | - |  |
|
| 92 |
 Comcast xStock
CMCSAX |
 Comcast |
$24,93 | 1.8% | 0.9% | 0.8% | 1.9% | 12.6% | $3 779,45 | $211 953 | $94 193 625 | 0,00 | - | - |  |
|
| 93 |
 Constellation Energy Corporation xStock
CEGX |
 Constellation Energy |
$274,93 | 0.2% | - | 0.1% | 13.9% | 0.4% | - | $209 045 | $67 744 348 | 0,00 | - | - |  |
|
| 94 |
 Schwab International Equity xStock
SCHFX |
 Schwab International Equity ETF |
$26,50 | 1.9% | 0.0% | 1.0% | 2.1% | 4.8% | $290,16 | $208 170 | $208 170 | 1,00 | - | - |  |
|
| 95 |
 Wrapped Tencent xStock
WTCENTX |
 Tencent - ADR |
$49,59 | 1.1% | 0.1% | 1.8% | 7.2% | 8.9% | $15 449,95 | $205 104 | $205 104 | 1,00 | - | - |  |
|
| 96 |
 Merck xStock
MRKX |
 Merck |
$149,78 | 0.6% | 0.0% | 1.2% | 1.9% | 1.8% | $292,48 | $202 058 | $145 666 674 | 0,00 | - | - |  |
|
| 97 |
 Global X Uranium ETF xStock
URAX |
 Global X Uranium ETF |
$30,52 | 3.2% | - | 23.5% | 23.2% | 39.0% | - | $200 669 | $36 216 502 | 0,01 | - | - |  |
|
| 98 |
 Accenture xStock
ACNX |
 Accenture |
$249,26 | 1.3% | 0.7% | 0.2% | 4.9% | 8.7% | $8 524,22 | $190 901 | $115 591 519 | 0,00 | - | - |  |
|
| 99 |
 Vida Global xStock
VIDAX |
 Vida Global |
$0,7419 | 2.2% | 7.3% | 6.0% | 7.4% | 35.2% | $9 804,40 | $190 507 | $65 517 481 | 0,00 | - | - |  |
|
| 100 |
 Danaher xStock
DHRX |
 Danaher |
$231,66 | 0.6% | 0.6% | 3.0% | 1.7% | 2.1% | $3 217,98 | $174 848 | $102 796 166 | 0,00 | - | - |  |
About xStocks
Are you the issuer? Submit a request to keep your details up to date.
Issuance
Identity
Issuing Entity
Backed Assets (JE) Limited
The legal company that issues this token. This may differ from the brand name.
Domicile
🇯🇪 Jersey
The country where it's registered.
Issuance Framework
Where and under which rules this product is offered. Some products involve several countries' laws.
🇱🇮 Liechtenstein · FMA · EU Prospectus Regulation base prospectus, passported across the EEA
🇯🇪 Jersey · JFSC · Jersey issuer consents
🇺🇸 United States · none · not registered
Structure
Tokenization Model
What the token legally is: the real asset, an interest in an asset held for you, or the issuer's own contract that tracks the price.
Third-Party Synthetic
The token is the issuer's own note or derivative that tracks the price. No real asset is held for you.
Legal Instrument
The legal form of what you hold: a share, fund unit, note, derivative, or claim on physical commodity.
Debt Security
A note owed to you by the token issuer. You're effectively a lender, with returns tied to the asset's price.
Claim Against
Who your claim points to: the real asset's issuer, a fund, the physical commodity itself, or the company that issued the token.
RWA Token Issuer
You're a creditor or counterparty of the company that issued the token, not an owner of the asset.
Backing Type
What stands behind your token: assets held specifically for you, a shared pool, pledged collateral, or only the issuer's promise.
Collateralized
Assets are pledged to holders, enforced by a security agent if needed. Recovery is capped at the collateral.
Holder Rights
Voting
Whether you can vote at shareholder or fund meetings, and how.
None
No voting rights.
Dividend
Whether and how you receive dividends or income from the underlying asset.
Reinvested Rebase
Payouts are reinvested automatically. Your token balance or value grows instead of you receiving cash.
Corporate Actions
How events like stock splits or mergers affect your holding.
Rebase
Your holding is adjusted to reflect events like splits, but you don't take part as a shareholder.
Pre-emptive Subscription Rights
Whether you get first right to buy new shares when the company issues more.
None
You don't get first right to buy new shares.
Information Disclosure Rights
What information you're legally entitled to receive, and from whom.
Via Platform, No Inspection Rights
The platform publishes data like NAV or proof-of-reserves. You have no legal right to inspect the issuer's books.
Enforcement / Legal Rights
Who you can take legal action against to enforce your rights.
Against Issuing Entity or SPV
You can pursue the token issuer, fund or special-purpose company, but your reach stops there.
Residual Liquidation Claim
What you'd be entitled to if the issuer went bankrupt, and how you'd rank against other creditors.
Secured Creditor on Collateral
You have a claim on specific pledged collateral if the issuer fails. Recovery is capped at what it sells for.
Access
Redemption
Whether you can return the token to the issuer, what you'd get back (cash or the real asset), and whether ID checks apply.
Cash Only
You can redeem the token with the issuer for cash.
Redemption KYC Required
Yes
Whether you must verify your identity before redeeming with the issuer.
Open to US Persons
No
Whether US persons are allowed to hold or buy this product.
KYC Required
No
Whether you must verify your identity to hold or buy this product.
Sophisticated Investors Only
No
Whether only professional, accredited or qualified investors can hold this product.
Transferability
Whether you can send this token to other wallets freely, only to approved wallets, or not at all.
Open
Freely transferable on-chain. Sanctions screening or issuer freezes may still apply.
Source
Evidence
assets.backed.fi
Info based on issuer documents listed above. Refer to the source for full terms.
xStocks Statistics
24h Volume by Token
24h Perps Volume by Token
Volume
Trading volume of xStocks's tokens over time.
Perps Volume
Perps trading volume of xStocks's tokens over time.


 Arba peržiūrėkite ją programėlių parduotuvėse


