





Porteføljer
Legg til ny portefølje

Største Base Native mynter etter markedsverdi
Den globale markedsverdien til Base Native er i dag USD114 Billion, en endring på -0.7% de siste 24 timene.
Høydepunkter
$114,139,251,285
Markedsverdi
0.7%

$9,357,136,178
24-timers omsetning


| # | Mynt | Kurs | 1t | 24t | 7d | 30d | 24t omsetning | Markedsverdi | FVM | Markedsverdi/FVM | Siste 7 dager | ||
|---|---|---|---|---|---|---|---|---|---|---|---|---|---|
| 9577 |

Based Doge
BDOGE
|
$0.057662 | 0.4% | 1.8% | 4.5% | 20.7% | $7.21 | $7,328.80 | $7,328.80 | 1.0 |
|
||
| 9587 |

deployer
DEPLOYER
|
$0.00001443 | 0.0% | 5.0% | 1.8% | 34.7% | $31.78 | $7,255.63 | $14,432.28 | 0.5027362346946536 |
|
||

Dregen
DREGEN
|
$0.057005 | 0.0% | 41.6% | 41.6% | 41.6% | $26.20 | $7,004.80 | $7,004.80 | 1.0 |

|
|||
| 9677 |

CDPANDA
CDPANDA
|
$0.056751 | 0.4% | 7.3% | 2.4% | 12.4% | $4.44 | $6,751.34 | $6,751.34 | 1.0 |
|
||

based aura
AURA
|
$0.0006272 | 0.0% | 1.1% | 3.6% | 20.0% | $2.05 | $6,272.50 | $6,272.50 | 1.0 |
|
|||
| 9795 |

Cosmo
COSMO
|
$0.056657 | 0.0% | 7.0% | 7.0% | 15.5% | $1.31 | $6,026.00 | $6,026.00 | 1.0 |
|
||

Lordy
LORDY
|
$0.056006 | 0.0% | 1.7% | 2.7% | 1.4% | $5.08 | $6,005.85 | $6,005.85 | 1.0 |
|
|||

BASED SNEK
SNEK
|
$0.055944 | 0.0% | 11.1% | 11.1% | 12.4% | $24.33 | $5,944.29 | $5,944.29 | 1.0 |
|
|||

Lightspeed
SPEED
|
$0.00001984 | 0.0% | 5.3% | 5.7% | 1.2% | $4.96 | $5,267.74 | $5,948.00 | 0.8856322937846812 |

|
|||

Mr Puggles
PUGGLES
|
$0.055135 | 0.0% | 2.2% | 2.7% | 16.0% | $4.21 | $5,134.62 | $5,134.62 | 1.0 |
|
|||
| 9944 |

BaseCTO
CTO
|
$0.00001252 | 0.0% | 3.9% | 5.3% | 14.1% | $78.95 | $5,126.87 | $11,977.27 | 0.42805003572843586 |
|
||

BRO on BASE
BRO
|
$0.055167 | 0.0% | 12.0% | 12.0% | 12.3% | $16.69 | $5,027.69 | $5,084.32 | 0.988860487027536 |

|
|||

Based Bario
BARIO
|
$0.054703 | 0.0% | 5.1% | 13.5% | 2.1% | $1.50 | $4,702.52 | $4,702.52 | 1.0 |

|
|||

Based Bill
BASEDBILL
|
$0.054384 | 0.0% | 1.6% | 0.6% | 0.0% | $8.47 | $4,383.69 | $4,383.69 | 1.0 |

|
|||

BMA
BMA
|
$0.0003735 | 0.0% | 36.2% | 36.2% | 114.4% | $1.24 | $3,872.58 | $3,872.58 | 1.0 |
|
|||

BUBU
BUBU
|
$0.053786 | 0.0% | 2.5% | 13.3% | 13.0% | $1.70 | $3,785.94 | $3,785.94 | 1.0 |

|
|||
| 10206 |

Alien Base
ALB
|
$0.003928 | 0.4% | 2.8% | 2.8% | 2.2% | $2,041.99 | $3,779.18 | $3,787.00 | 0.9979339159960456 |
|
||

Ricky The Raccoon
RICKY
|
$0.053642 | 0.0% | 7.9% | 7.9% | 12.9% | $10.58 | $3,642.12 | $3,642.12 | 1.0 |
|
|||

BOOK OF RUGS
BOOK OF RUGS
|
$0.054505 | 0.0% | 18.7% | 32.8% | 33.4% | $368.44 | $3,636.30 | $4,271.47 | 0.8512994532004522 |

|
|||

SALUKI
SALUKI
|
$0.053365 | 0.0% | 1.8% | 9.8% | 2.6% | $7.21 | $3,364.60 | $3,364.60 | 1.0 |
|
|||

PERPY
PERPY
|
$0.00001980 | 0.0% | 5.5% | 18.6% | 49.3% | $24.40 | $1,980.21 | $1,980.21 | 1.0 |
|
|||

Crappy Bird CTO
CRAPPY
|
$0.051588 | 0.0% | 59.1% | 97.2% | 18.0% | $13.16 | $1,902.14 | $1,902.14 | 1.0 |

|
|||

Brish
BRISH
|
$0.059250 | 0.0% | 0.4% | 5.2% | 13.6% | $1.47 | - | $9,250.35 |

|
||||

Misser
MISSER
|
$0.00001312 | 0.0% | 1.7% | 12.9% | 10.3% | $1.30 | - | $13,120.29 |
|
||||

BOGE
BOGE
|
$0.059458 | 0.0% | 5.5% | 9.8% | 27.5% | $1.99 | - | $9,457.92 |

|
||||

TONY
TONY
|
$0.054664 | 0.0% | 1.7% | 4.6% | 19.8% | $15.51 | - | $4,664.07 |

|
||||

Onchain Summer
SUMMER
|
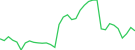
$0.057856 | 0.0% | 5.9% | 5.9% | 3.8% | $13.15 | - | $7,698.90 |
|
||||

Siamese
SIAM
|
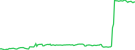
$0.094227 | 0.4% | 2.5% | 1.6% | 37.4% | $52.06 | - | $4,227.26 |
|
||||

Riky The Raccoon
RIKY
|
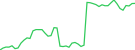
$0.00001108 | 0.0% | 0.5% | 0.1% | 11.3% | $7.06 | - | $11,083.07 |
|
||||

Penjamin Blinkerton
PEN
|
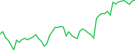
$0.075316 | 0.0% | 1.9% | 4.2% | 7.6% | $6.60 | - | $53,156.80 |
|
||||

kurbi
KURBI
|
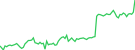
$0.0001675 | 0.4% | 2.0% | 4.5% | 12.7% | $3.19 | - | $16,748.73 |
|
||||

Bento
BENTO
|
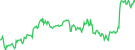
$0.081164 | 0.4% | 2.4% | 4.1% | 15.5% | $4.65 | - | $116,450 |
|
||||

Baby Sato
BABYSATO
|
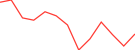
$0.058380 | 0.0% | 5.8% | 12.7% | 15.1% | $3.66 | - | $8,380.35 |
|
||||

Klima Protocol kVCM
KVCM
|
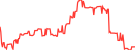
$0.02205 | 0.0% | 7.9% | 19.2% | 1.2% | $1,220.38 | - | $440,932 |
|
||||

DexFi Governance
GDEX
|
$10.59 | 0.2% | 0.4% | 3.1% | 14.4% | $303.78 | - | $1,270,952 |
|
||||

Qawalla
QWLA
|
$0.09278 | 0.4% | 2.3% | 0.7% | 12.8% | $3,325.55 | - | $9,278,138 |
|
||||

Royal Finance Coin
RFC
|
$0.0002009 | 0.0% | 0.5% | 0.7% | 5.0% | $29.38 | - | $1,004,496 |

|
||||

AxonDAO Governance Token [OLD]
AXGT
|
$0.003288 | 0.0% | 28.3% | 44.0% | 30.9% | $146.77 | - | $3,288,294 |
|
||||

BitBall
BALL
|
$0.052563 | 0.0% | 54.2% | 60.5% | 83.0% | $196.11 | - | $82,025.05 |
|
||||

MAI (Base)
MIMATIC
|
$0.9705 | 0.6% | 0.7% | 3.0% | 3.7% | $19,902.41 | - | $2,474,724 |
|
||||

Nexa
NXA
|
$1.13 | 0.1% | 0.7% | 0.3% | 3.2% | $5,866.40 | - | $1,131,302,261 |
|
||||

Lyvely
LVLY
|
$0.001790 | 0.1% | 0.1% | 0.1% | 21.3% | $8,352.32 | - | $1,790,458 |
|
||||

Braintrust
BTRST
|
$0.05805 | 0.3% | 3.4% | 1.0% | 4.3% | $9,203.14 | - | $14,512,426 |
|
||||

XTTA
XTTA
|
$0.01184 | 0.0% | 4.2% | 9.7% | 22.5% | $4,341.55 | - | $3,797,600 |
|
||||

Zeebu
ZBU
|
$0.4217 | 0.0% | 0.0% | 0.0% | 1.3% | $1,222.47 | - | $2,108,262,401 |
|
||||

Satoshi Stablecoin
SATUSD
|
$0.9917 | 0.0% | 0.2% | 0.2% | 0.2% | $2.87 | - | $110,633,186 |
|
||||

Staked BIFI
MOOBIFI
|
$99.41 | 0.4% | 3.1% | 11.2% | 2.1% | $382.69 | - | - |
|
||||

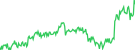
DCAI
DCAI
|
$1.03 | 0.2% | 3.0% | 7.1% | 22.9% | $8,700.79 | - | $102,719,635 |
|
||||

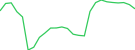
Cyberlife
LIFE
|
$0.0001396 | 0.0% | 1.8% | 6.1% | 95.1% | $14.63 | - | $13,963.41 |
|
||||

Summer
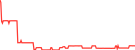
SUMR
|
$0.00006569 | 0.0% | 0.6% | 2.5% | 14.3% | $1.32 | - | $65,685.68 |
|
||||

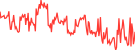
ViciCoin
VCNT
|
$18.51 | 0.0% | 0.3% | 0.0% | 5.3% | $130,305 | - | $185,080,633 |
|
||||

Axelar Bridged USDC
AXLUSDC
|
$0.9996 | 0.0% | 0.0% | 0.0% | 0.0% | $164,989 | - | $59,275,931 |
|
||||

Ribbita by Virtuals [OLD]
TIBBIR
|
Kjøp
|
$0.2254 | 0.4% | 3.3% | 4.2% | 7.4% | $1,038,763 | - | $214,036,507 |
|
|||
Viser 501 til 553 av 553 resultater
Rader
Markedsverdi-graf Base Native over ledende mynter
Grafen nedenfor viser markedsverdien og dominansen til store. Base Native inkludert USDC, USDS, Chainlink og andre, over en tidsperiode.
Prestasjonsgraf Base Native over ledende mynter
Grafen nedenfor viser den relative ytelsen til ledende Base Native mynter over tid, og sporer prosentvise prisgevinster og tap i forskjellige tidsperioder.




 Eller sjekk ut i App Store


