





Portfolios
Zu neuem Portfolio hinzufügen


Top-Analyse-Währungen nach Marktkapitalisierung
Die Marktkapitalisierung von Analyse beträgt heute 1,25 Milliarde $, eine Veränderung von 0.0% in den letzten 24 Stunden.
Höhepunkte
$1.250.781.710
Marktkap
0.0%

$104.831.317
24-Stunden-Handelsvolumen


| # | Kryptowährung | Kurs | 1h | 24h | 7d | 30d | 24-Stunden-Volumen | Marktkapitalisierung | FDV | Marktkapitalisierung /FDV | Letzte 7 Tage | ||
|---|---|---|---|---|---|---|---|---|---|---|---|---|---|
| 8776 |

Tradescoop by Virtuals
SCOOP
|
$0,00002268 | 0.0% | 25.5% | 25.5% | 27.0% | $31,60 | $22.682,43 | $22.682,43 | 1.0 |

|
||
| 8832 |

AInalyst
AIN
|
$0,00002231 | 0.6% | 4.4% | 23.7% | 35.0% | $1,69 | $22.306,57 | $22.306,57 | 1.0 |

|
||
| 8949 |

Navigate
NVG8
|
$0,00008374 | 0.0% | 0.8% | 0.8% | 9.4% | $2,05 | $21.128,81 | $83.741,27 | 0.25231056655503403 |

|
||
| 8995 |

ReVault
RVAULT
|
$0.062074 | 0.0% | 1.5% | 16.1% | 26.2% | $1,42 | $20.735,28 | $20.735,28 | 1.0 |

|
||
| 9164 |

Pentagon Pizza Watch
PPW
|
$0,00001953 | 0.0% | 2.7% | 25.1% | 39.3% | $49,29 | $19.534,55 | $19.534,55 | 1.0 |

|
||
| 9155 |

Hyperbot
BOT
|
$0,0001552 | 0.0% | 4.0% | 39.3% | 36.9% | $63,57 | $19.533,36 | $155.232 | 0.125833333 |

|
||
| 9210 |

opensvm.com
SVMAI
|
$0,00001912 | 0.0% | 19.8% | 19.8% | 34.7% | $5,49 | $19.113,95 | $19.113,95 | 1.0 |

|
||
| 9232 |

Howl.fi
HOWL
|
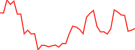
$0,00001896 | 0.5% | 1.5% | 37.9% | 0.0% | $32,68 | $18.959,64 | $18.959,64 | 1.0 |
|
||
| 9261 |

Velvet AI
VELAI
|
$0,00001694 | 2.3% | 1.9% | 15.5% | 23.2% | $44,34 | $18.713,94 | $18.713,94 | 1.0 |

|
||
| 9376 |

Helio
HELIO
|
$0,00001944 | 0.0% | 15.6% | 12.8% | 33.1% | $1,83 | $17.933,75 | $17.933,75 | 1.0 |

|
||
| 9512 |

Mind AI
MA
|
$0,00003717 | 0.0% | 0.0% | 6.3% | 43.9% | $7,21 | $16.844,46 | $18.585,62 | 0.9063165495639125 |

|
||
| 9552 |

Oren
OREN
|
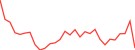
$0,00001804 | 5.4% | 11.3% | 23.9% | 0.0% | $4.688,92 | $16.583,52 | $16.583,52 | 1.0 |
|
||
| 9604 |

Prometheus
PROMETHEUS
|
$0,00003217 | 0.0% | 25.3% | 25.3% | 5.7% | $5,78 | $16.085,22 | $32.172,93 | 0.4999614075370567 |

|
||
| 9622 |

gemxbt
GEMXBT
|
$0,00001689 | 0.0% | 0.9% | 21.3% | 35.6% | $1,12 | $16.035,82 | $16.035,82 | 1.0 |

|
||
| 9738 |

ComputeBase
COMPUTE
|
$0.061523 | 0.0% | 0.3% | 0.2% | 10.5% | $6,30 | $15.230,32 | $15.230,32 | 1.0 |

|
||
| 9750 |

TetraScore
SCORE
|
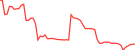
$0,00001516 | 0.0% | 3.4% | 5.8% | 34.7% | $24,61 | $15.157,23 | $15.157,23 | 1.0 |
|
||
| 9772 |

UpScalp
UPSCALP
|
$0,00001678 | 0.0% | 0.6% | 11.1% | 39.1% | $27,42 | $15.049,22 | $16.777,56 | 0.8969851681456672 |

|
||
| 9828 |

Omnis Genesis by Virtuals
OMNI
|
$0,00001730 | 0.0% | 0.5% | 4.0% | 7.1% | $1,51 | $14.614,96 | $14.614,96 | 1.0 |

|
||
| 10077 |

SYLVI AGENT
SYLVIAI
|
$0,00001318 | 0.0% | 6.4% | 10.5% | 27.4% | $1,29 | $13.179,76 | $13.179,76 | 1.0 |

|
||
| 10143 |

Checkr
$CHECKR
|
$0.064599 | 0.0% | 2.4% | 14.6% | 34.1% | $5,36 | $12.865,40 | $44.382,52 | 0.28987530046836074 |

|
||
| 10189 |

FOCO
FOCO
|
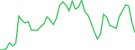
$0,00001264 | 0.0% | 3.0% | 97.9% | 0.0% | $96,08 | $12.635,73 | $12.635,73 | 1.0 |
|
||
| 10204 |

HooderScan
HOODER
|
$0,00001675 | 0.0% | 49.2% | 92.6% | 70.6% | $1.062,53 | $12.560,66 | $16.747,55 | 0.75 |

|
||
| 10218 |

Melvin
MEL
|
$0,00001249 | 0.0% | 4.5% | 30.9% | 51.7% | $134,38 | $12.490,40 | $12.490,40 | 1.0 |

|
||
| 10249 |

BelieveScreener
BSCREENER
|
$0,00001237 | 0.0% | 1.0% | 14.7% | 15.1% | $1,00000 | $12.367,35 | $12.367,35 | 1.0 |

|
||
| 10406 |

PATRIOT
PATRIOT
|
$0,00001165 | 0.0% | 6.6% | 12.6% | 32.4% | $15,72 | $11.653,01 | $11.653,01 | 1.0 |

|
||
| 10495 |

Wallitelli
WALLI
|
$0,00001129 | 0.0% | 25.2% | 47.4% | 97.5% | $580.383 | $11.291,22 | $11.291,22 | 1.0 |

|
||
| 10589 |

SocialCrab
SCRB
|
$0,00001089 | 0.0% | 6.7% | 4.9% | 23.5% | $211,62 | $10.888,71 | $10.888,71 | 1.0 |

|
||
| 10633 |

Generative Market eXplorer
AIGMX
|
$0,00001071 | 0.0% | 0.7% | 17.2% | 35.6% | $1,64 | $10.705,22 | $10.705,22 | 1.0 |

|
||
| 10658 |

Anti Rug Agent
ANTIRUG
|
$0,00001063 | 0.0% | 6.1% | 20.8% | 33.6% | $29,11 | $10.623,29 | $10.623,29 | 1.0 |

|
||
| 10955 |

BubbleFlap
BFLAP
|
$0,00001057 | 1.1% | 1.6% | 12.5% | 24.3% | $26,85 | $9.545,88 | $9.545,88 | 1.0 |

|
||
| 11003 |

Deepnets
DNET
|
$0.059748 | 0.0% | 7.9% | 23.7% | 55.1% | $289,28 | $9.332,08 | $9.332,08 | 1.0 |

|
||
| 11086 |

Liquidum
LIDUM
|
$0.059045 | 0.0% | 29.2% | 29.2% | 32.9% | $2,78 | $9.044,88 | $9.044,88 | 1.0 |

|
||
| 11228 |

Strategic ETH Reserve
SΞR
|
$0,00008553 | 0.0% | 0.6% | 18.9% | 25.5% | $8,55 | $8.552,68 | $8.552,68 | 1.0 |

|
||
| 11371 |

Exodus AI
EXO
|
$0.058169 | 0.0% | 4.1% | 11.9% | 25.9% | $4,09 | $8.073,65 | $8.073,65 | 1.0 |

|
||
| 11535 |

Arcvein
ARCVEIN
|
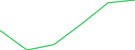
$0.057616 | 2.4% | 6.6% | 45.9% | 0.0% | $166,24 | $7.615,59 | $7.615,59 | 1.0 |
|
||
| 11554 |

Trio ICM
TRIO
|
$0.057575 | 0.0% | 0.1% | 24.2% | 30.3% | $1,77 | $7.574,87 | $7.574,87 | 1.0 |

|
||
| 11729 |

BelievePad
BPAD
|
$0.057082 | 0.0% | 16.0% | 16.0% | 21.7% | $1,90 | $7.062,76 | $7.062,76 | 1.0 |

|
||
| 11744 |

Hoodwatch
WATCH
|
$0.057025 | 0.1% | 4.6% | 23.1% | 61.8% | $53,35 | $7.025,20 | $7.025,20 | 1.0 |

|
||
| 11873 |

PredicTools
PREDIC
|
$0.056696 | 0.0% | 5.2% | 15.4% | 33.6% | $7,44 | $6.693,49 | $6.693,49 | 1.0 |

|
||
| 12018 |

Chain-Fox
CFX
|
Kaufen
|
$0.056336 | 0.0% | 0.7% | 8.2% | 13.3% | $2,08 | $6.334,84 | $6.334,84 | 1.0 |

|
|
| 12096 |

BOW
BOW
|
$0.057088 | 0.0% | 3.7% | 16.8% | 26.7% | $3,24 | $6.155,91 | $6.155,91 | 1.0 |

|
||
| 12139 |

Fable
FABLE
|
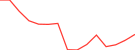
$0.056560 | 0.0% | 5.6% | 21.7% | 10.8% | $1,03 | $6.046,05 | $6.046,05 | 1.0 |
|
||
| 12190 |

VirtuBeauty by Virtuals
VBEA
|
$0.055950 | 0.0% | 5.0% | 17.8% | 31.3% | $4,77 | $5.950,23 | $5.950,23 | 1.0 |

|
||
| 12328 |

We Will Huddle
HUDDLE
|
$0.055725 | 0.0% | 5.2% | 13.5% | 25.9% | $1,64 | $5.673,41 | $5.673,41 | 1.0 |

|
||
| 12487 |

AAAI_agent by Virtuals
AAAI
|
$0.055363 | 0.0% | 27.7% | 27.7% | 45.5% | $116,81 | $5.362,99 | $5.362,99 | 1.0 |

|
||
| 12606 |

Ocula
OCULA
|
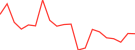
$0.055379 | 0.0% | 1.6% | 3.0% | 87.8% | $14,75 | $5.124,86 | $5.124,86 | 1.0 |
|
||
| 12732 |

Kyro Markets
KYRO
|
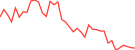
$0.054839 | 0.0% | 0.2% | 36.6% | 0.0% | $9,90 | $4.838,86 | $4.838,86 | 1.0 |
|
||
| 12807 |

toaster.trade
TOASTER
|
$0.055539 | 0.0% | 21.0% | 21.0% | 21.0% | $1,36 | $4.707,97 | $4.707,97 | 1.0 |

|
||
| 12935 |

Opus The Trencher
OPUS
|
$0.054626 | 0.0% | 0.8% | 20.1% | 37.6% | $0,9927 | $4.493,68 | $4.493,68 | 1.0 |

|
||
| 13088 |

Degen Social Media
DEGEN
|
$0.054233 | 0.0% | 1.1% | 1.1% | 15.5% | $183,37 | $4.227,19 | $4.227,19 | 1.0 |

|
||
| 13114 |

RiceLabs
RICE
|
$0.054191 | 0.0% | 3.3% | 3.3% | 13.4% | $1,11 | $4.191,17 | $4.191,17 | 1.0 |

|
||
| 13373 |

XScouter AI
XSAI
|
$0,007581 | 0.0% | 0.0% | 2.4% | 13.1% | $3,48 | $3.790,31 | $3.790,31 | 1.0 |

|
||
| 13418 |

Julia Swarm Syndicate
JSS
|
$0.053858 | 0.0% | 3.2% | 18.6% | 25.8% | $1,85 | $3.720,44 | $3.720,44 | 1.0 |

|
||
| 13429 |

RobinSight
SIGHT
|
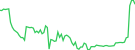
$0.053708 | 0.5% | 12.4% | 21.2% | 35.3% | $7,74 | $3.708,34 | $3.708,34 | 1.0 |
|
||
| 13431 |

INVARA Core
INVR
|
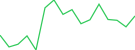
$0.054109 | 0.5% | 0.7% | 20.2% | 0.0% | $47,09 | $3.704,29 | $4.108,99 | 0.9015099837412969 |
|
||
| 13440 |

Sounder Liquidity
SOUNDER
|
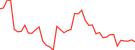
$0.053681 | 0.0% | 0.6% | 21.9% | 70.5% | $2,03 | $3.680,70 | $3.680,70 | 1.0 |
|
||
| 13595 |

DexChart
CHART
|
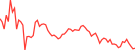
$0.053445 | 0.0% | 4.0% | 1.3% | 18.1% | $2,63 | $3.444,95 | $3.444,95 | 1.0 |
|
||
| 13690 |

Thesis AI
THESIS
|
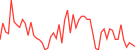
$0.053319 | 0.5% | 0.3% | 17.5% | 96.8% | $12,11 | $3.318,97 | $3.318,97 | 1.0 |
|
||
| 13808 |

0xsim by Virtuals
SAGE
|
$0.053161 | 0.0% | 0.8% | 16.5% | 35.7% | $2,00 | $3.160,64 | $3.160,64 | 1.0 |

|
||
| 13860 |

AstheraFi
ASTHER
|
$0.053107 | 0.0% | 7.8% | 7.8% | 12.4% | $8,06 | $3.107,11 | $3.107,11 | 1.0 |

|
||
| 13870 |

HUME MARKETS
HUME
|
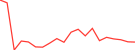
$0.053102 | 0.5% | 12.8% | 15.4% | 80.8% | $25,61 | $3.102,12 | $3.102,12 | 1.0 |
|
||
| 13927 |

Grail
GRAIL
|
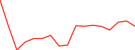
$0.053352 | 0.0% | 7.4% | 1.4% | 62.6% | $3,88 | $3.021,79 | $3.021,79 | 1.0 |
|
||
| 14000 |

Super Intelligent Identity
SIMD
|
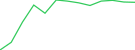
$0.052930 | 0.0% | 0.3% | 19.2% | 53.9% | $1,45 | $2.930,14 | $2.930,14 | 1.0 |
|
||
| 14174 |

Quanta
QNTA
|
$0.052794 | 0.0% | 4.1% | 9.6% | 23.1% | $1,49 | $2.737,97 | $2.737,97 | 1.0 |
|
||
| 14178 |

Lashi
LASHI
|
$0.052735 | 0.0% | 6.3% | 6.3% | 27.5% | $1,50 | $2.734,94 | $2.734,94 | 1.0 |

|
||
| 14350 |

BubbleLabs
BUBBLE
|
$0.052632 | 0.0% | 5.9% | 5.9% | 5.9% | $3,64 | $2.552,76 | $2.552,76 | 1.0 |

|
||
| 14533 |

Glint
$GLINT
|
$0.073346 | 0.0% | 30.1% | 46.3% | 0.0% | $401,86 | $2.342,52 | $3.346,46 | 0.7000000000000001 |

|
||
| 14538 |

MCAPS
MCAPS
|
$0.052337 | 0.0% | 7.4% | 18.4% | 99.1% | $36,69 | $2.336,75 | $2.336,75 | 1.0 |
|
||
| 14581 |

Raindrop
RAIN
|
Kaufen
|
$0.052272 | 0.0% | 2.5% | 11.7% | 24.6% | $2,26 | $2.271,28 | $2.271,28 | 1.0 |

|
|
| 14586 |

SWARM ENGINE
SWARM
|
$0.052280 | 0.0% | 0.4% | 14.3% | 87.3% | $1,93 | $2.263,97 | $2.263,97 | 1.0 |
|
||
| 14667 |

Lens
LENS
|
$0.052195 | 0.0% | 7.6% | 8.2% | 73.3% | $39,12 | $2.154,83 | $2.194,48 | 0.981932825344961 |

|
||
| 14708 |

sinex
SINX
|
$0.061206 | 0.0% | 3.4% | 3.4% | 31.2% | $1,03 | $2.082,37 | $2.082,37 | 1.0 |

|
||
| 14895 |

Alpha Lens X
ALPHAX
|
$0.051829 | 0.0% | 21.0% | 21.0% | 21.0% | $4,58 | $1.759,76 | $1.759,76 | 1.0 |

|
||

KROWN
KRW
|
$0.051854 | 0.4% | 0.2% | 6.2% | 45.6% | $35,89 | - | $18.543,52 |

|
||||

Ness Lab
NESS
|
$0,001471 | 0.3% | 1.7% | 19.4% | 41.2% | $19.136,10 | - | - |

|
||||

Pullix
PLX
|
$0,0006227 | 0.0% | 3.3% | 15.4% | 19.2% | $2,11 | - | $124.539 |

|
||||

Sypool
SYP
|
$0,00006567 | 0.1% | 0.6% | 11.0% | 15.7% | $43,14 | - | $65.674,72 |

|
||||

Bitcoin Silver AI
BSAI
|
$1.654,31 | 0.0% | 1.6% | 1.3% | 13.8% | $201.825 | - | $1.654.313.476.376 |

|
||||

XTTA
XTTA
|
$0,005457 | 0.0% | 1.7% | 29.5% | 56.3% | $734,91 | - | $1.743.936 |

|
||||

Centcex
CENX
|
$0,00005451 | 0.3% | 0.0% | 13.3% | 18.8% | $50,06 | - | $545.131 |

|
||||

AXiS ALiVE
AXIS
|
$283,77 | 0.6% | 3.4% | 2.6% | 9.5% | $262,18 | - | $283.769.370 |

|
||||

Reflecto
RTO
|
$0.096892 | 0.0% | 1.4% | 5.4% | 16.3% | $47,49 | - | $689.150 |

|
||||

Inery
$INR
|
$0,0004408 | 0.0% | 1.2% | 1.2% | 2.3% | $1,98 | - | $352.651 |

|
||||

DataPort Navigator by Virtuals
PORT
|
$0,00001893 | 0.0% | 4.0% | 20.4% | 40.9% | $1,69 | - | $18.932,84 |

|
||||

AltsDaddy
DDY
|
$0,00 | - | - | - | - | - | - | - |

|
||||

Trading Views
TRADINGVIEWS
|
$0,00 | - | - | - | - | - | - | - |

|
||||

AlphaRadarX
ARX
|
$0,00 | - | - | - | - | - | - | - |

|
||||

Dm.fun
FUN
|
$0,00 | - | - | - | - | - | - | - |

|
||||

Zeno Divergent [OLD]
ZENO
|
$0.051709 | 0.0% | 1.8% | 21.5% | 95.1% | $3,69 | - | $1.665,89 |
|
||||

ArexAI
ARXAI
|
$0,00 | - | - | - | - | - | - | - |

|
||||

elyscan
ELYSCAN
|
$0,00 | - | - | - | - | - | - | - |

|
||||

EVRITHNG
EVRI
|
$0,0004746 | 0.1% | 2.7% | 80.0% | 0.0% | $8,00 | - | $9.946,11 |
|
||||

FINDEXY
FINDEXY
|
$3,00 | 0.0% | 0.0% | 0.0% | 0.0% | $1.895,13 | - | $62.896.155.279 |
|
||||
Es werden 101 bis 193 von 193 Ergebnissen angezeigt
Zeilen
Top AnalyseKryptowährungen Marktkap-Chart
Das folgende Chart zeigt die Marktkapitalisierung und Dominanz in den Top Analyse, einschließlich Pyth Network, The Graph, SoSoValue und andere, über einen bestimmten Zeitraum.
Top AnalyseKryptowährungen Performance-Chart
Das folgende Chart zeigt die relative Performance von Top Analyse Kryptowährungen im Laufe der Zeit und verfolgt ihre prozentualen Gewinne und Verluste in Bezug auf den Kurs über verschiedene Zeiträume.


 Oder schauen Sie sich die App in den App Stores an


