





Carteras
Añadir a la nueva cartera

Seguir
![]() vaya donde vaya
Reciba las novedades en tiempo real mediante notificaciones push en la aplicación.
Abrir aplicación
Las principales monedas Plataforma de contrato inteligente según la capitalización de mercado
La capitalización de mercado de Plataforma de contrato inteligente hoy es de 1,87 billón $, lo que supone un cambio del 0.0% en las últimas 24 horas.
Lo más destacado
$1.870.479.941.126
Cap. mercado
0.0%

$55.777.002.952
Volumen en 24 horas


| # | Moneda | Precio | 1 h | 24 h | 7 d | 30 d | Volumen en 24 h | Cap. de mercado | FDV | Cap. de mercado/FDV | Últimos 7 días | ||
|---|---|---|---|---|---|---|---|---|---|---|---|---|---|
| 13005 |

PARANOID
PARANOID
|
$0.054543 | 1.5% | 4.3% | 68.1% | 0.0% | $613,12 | $4.531,02 | $4.531,02 | 1.0 |
|
||
| 13016 |

THREE
$THREE
|
$0,00004507 | 0.0% | 7.5% | 38.6% | 57.0% | $3,87 | $4.507,21 | $4.507,21 | 1.0 |
|
||
| 13151 |

Silensio
SILEN
|
$0.054658 | 0.0% | 0.4% | 8.9% | 25.8% | $4,43 | $4.316,74 | $4.658,41 | 0.9266551589119622 |

|
||
| 13345 |

Zintech
ZINTECH
|
$0.054169 | 0.0% | 0.7% | 1.8% | 12.7% | $5,02 | $3.994,22 | $3.994,22 | 1.0 |

|
||
| 13356 |

OBEX
OBEX
|
$0.053984 | 0.0% | 2.1% | 15.0% | 28.8% | $40,47 | $3.983,39 | $3.983,39 | 1.0 |
|
||
| 13901 |

Moonchain
MCH
|
$0,00001352 | 0.0% | 80.0% | 1.1457670923264304e+16% | 1.1457670923264304e+16% | $5,65 | $3.266,22 | $13.519,13 | 0.2416000002416 |
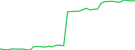
|
||
| 13999 |

Datagram Network
DGRAM
|
$0,00001266 | 1.1% | 11.7% | 12.1% | 26.9% | $61,80 | $3.148,64 | $126.553 | 0.024880000000000003 |
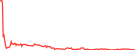
|
||
| 14032 |

ZKWASM
ZKWASM
|
$0,00006162 | 0.0% | 2.7% | 10.1% | 28.7% | $2,12 | $3.117,18 | $61.622,58 | 0.050585000000000005 |
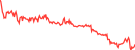
|
||
| 14044 |

Mute
MUTE
|
$0,00007769 | 0.0% | 1.3% | 13.5% | 35.3% | $2,68 | $3.107,69 | $3.107,69 | 1.0 |
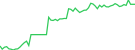
|
||
| 14374 |

Idena
IDNA
|
$0,00002629 | 0.0% | 0.0% | 97.8% | 97.5% | $1,46 | $2.750,89 | $4.261,13 | 0.6455781809523969 |
|
||
| 14644 |

Oxai
OXAI
|
$0,00004114 | 0.0% | 3.6% | 9.3% | 21.6% | $24,26 | $2.468,12 | $4.113,53 | 0.6 |
|
||
| 14921 |

zk402
ZK402
|
$0.052073 | 0.0% | 6.5% | 38.1% | 38.1% | $4,15 | $2.070,11 | $2.070,11 | 1.0 |
|
||
| 14964 |

Zenrock
ROCK
|
$0.055111 | 0.0% | 0.0% | 83.6% | 84.1% | $0,1158 | $1.995,80 | $5.110,95 | 0.390494901 |
|
||
| 15189 |

Stohn Coin
SOH
|
$0,001219 | 0.0% | 19.6% | 1.7% | 69.3% | $24,48 | $1.385,07 | $1.385,07 | 1.0 |
|
||
| 15275 |

Multiple Network
MTP
|
$0,00002033 | 0.0% | 14.9% | 11.7% | 87.2% | $42,99 | $914,96 | $20.332,44 | 0.045000000000000005 |
|
||
| 15492 |

AXION
AXION
|
$0.069987 | 0.0% | 50.0% | 98.8% | 90.0% | $139,81 | $249,68 | $998,74 | 0.25 |
|
||
| 15722 |

IRISnet
IRIS
|
$0.071359 | 0.0% | 0.6% | 15.2% | 32.5% | $0,09959 | $19,58 | $29,20 | 0.670685002367769 |
|
||

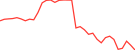
Secret (ERC20)
WSCRT
|
$0,01056 | 0.0% | 17.8% | 17.8% | 26.3% | $34,18 | - | $12.319,43 |
|
||||

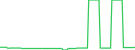
Fantom
FTM
|
$0,03222 | 0.0% | 2.3% | 13.0% | 41.5% | $1.202,02 | - | $102.313.961 |
|
||||

MATIC (migrated to POL)
MATIC
|
$0,1262 | - | - | - | - | $0,1468 | - | $1.261.558.705 |

|
||||

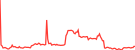
PERL.eco
PERL
|
$0,0001050 | 0.0% | 5.8% | 16.5% | 21.6% | $258,72 | - | $72.765,54 |
|
||||

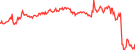
Aergo [OLD]
AERGO
|
$0,01551 | 5.8% | 1.3% | 0.1% | 4.2% | $110.335 | - | $7.752.983 |
|
||||

Naka Bodhi
NBOT
|
$0,006995 | 0.0% | 0.0% | 0.0% | 0.0% | $5,10 | - | $699.517 |
|
||||

EOS
EOS
|
$0,06732 | 0.1% | 3.3% | 11.1% | 37.6% | $50.932,42 | - | $141.364.335 |
|
||||

Coreum [OLD]
COREUM
|
$0,007258 | 0.0% | 15.7% | 15.7% | 16.3% | $8,11 | - | $4.715.503 |
|
||||

Ink
INK
|
$0,00 | - | - | - | - | - | - | - |

|
||||

Fruits
FRTS
|
$0.053726 | 0.1% | 0.2% | 4.3% | 17.5% | $83.050,78 | - | $148.932 |
|
||||

c8ntinuum
CTM
|
Comprar
|
$0,1973 | 1.0% | 0.0% | 2.1% | 6.3% | $3.711.605 | - | $1.754.043.661 |
|
|||

Lightchain AI
LCAI
|
$0,0008508 | 1.0% | 6.7% | 20.2% | 10.8% | $19.166,70 | - | $8.507.956 |
|
||||

SAFE(AnWang)
SAFE
|
$1,55 | 0.0% | 6.0% | 1.1% | 17.2% | $13.269,92 | - | $3.927.122 |
|
||||

Turingbitchain
TBC
|
$3,71 | 1.8% | 4.9% | 3.0% | 23.5% | $194.950 | - | $557.325.814 |
|
||||

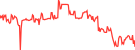
MEVerse
MEV
|
$0,002371 | 0.1% | 5.7% | 1.2% | 13.5% | $312.967 | - | $4.700.806 |
|
||||

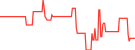
Rubix
RBT
|
$1,49 | 0.0% | 19.5% | 89.3% | 94.1% | $859,61 | - | $9.200.142 |
|
||||

Asset
ASSET
|
$0,00 | - | - | - | - | - | - | - |

|
||||

Darwinia Network xRING
XRING
|
$0,00 | - | - | - | - | - | - | - |

|
||||

Berachain Governance Token
BGT
|
$0,00 | - | - | - | - | - | - | - |

|
||||

Bitcorn
BTCN
|
$0,00 | - | - | - | - | - | - | - |

|
||||

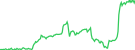
Layer One X
L1X
|
$7,00 | 0.0% | 0.4% | 0.1% | 14.9% | $53.186,54 | - | $4.107.363.406 |
|
||||

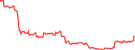
Quantum Fusion
QF
|
$0,02871 | 1.0% | 0.2% | 20.8% | 38.6% | $58,97 | - | $287.125 |
|
||||

MANA3
MANA3
|
$0,003589 | 0.5% | 0.3% | 8.3% | 35.5% | $17.112,51 | - | $1.799.061 |
|
||||

Zedxion
ZEDX
|
$0,00 | - | - | - | - | - | - | - |

|
||||

Maal Chain
MAAL
|
$0,1778 | 0.3% | 0.9% | 4.5% | 7.6% | $870.022 | - | $1.778.226.592 |
|
||||

Paladeum
PLB
|
$0,1708 | 0.0% | 1.9% | 5.9% | 14.6% | $79,86 | - | $170.768.108 |
|
||||

SMART BLOCKCHAIN
SMART
|
$0,003870 | 0.3% | 1.1% | 5.8% | 10.8% | $134.577 | - | $34.831.840.014 |
|
||||

Japan Open Chain
JOC
|
$0,01121 | 1.2% | 32.3% | 49.4% | 60.5% | $2.816,92 | - | $11.211.341 |
|
||||

GRAIN
GRAIN
|
$0,00 | - | - | - | - | - | - | - |

|
||||

Klever Finance
KFI
|
$0,2153 | 0.2% | 0.5% | 6.8% | 28.5% | $113,99 | - | $4.521.027 |
|
||||

Bitcoin Vault
BTCV
|
$0,3466 | 0.4% | 0.5% | 13.8% | 22.3% | $108.538 | - | $7.278.093 |
|
||||

Marscoin
MARS
|
$0,06030 | 0.1% | 0.1% | 1.6% | 15.5% | $7.307,78 | - | $2.411.897 |
|
||||

Polis
POLIS
|
$0,0001447 | 0.3% | 1.1% | 1.9% | 11.3% | $9,28 | - | $2.453,77 |
|
||||

Primecoin
XPM
|
$0,01799 | 0.0% | 0.0% | 5.7% | 47.1% | $5,56 | - | $902.974 |
|
||||

Bitcoin Atom
BCA
|
$0,05591 | 1.0% | 24.4% | 9.7% | 38.0% | $40,25 | - | $1.174.022 |
|
||||

Bytecoin
BCN
|
$0,00002663 | 0.0% | 4.8% | 4.8% | 11.1% | $9,07 | - | $4.902.515 |

|
||||

MimbleWimbleCoin
MWC
|
Comprar
|
$9,08 | 8.6% | 24.7% | 5.9% | 25.7% | $24.223,45 | - | $100.032.058 |
|
|||

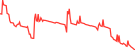
Lemon
LEMX
|
$4,00 | 0.0% | 3.7% | 18.1% | 33.6% | $10.333,29 | - | $199.901.277 |
|
||||

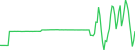
EIOB
EIOB
|
$5,06 | 1.0% | 3.4% | 2.0% | 6.3% | $44.009,17 | - | $50.640.887.660 |
|
||||

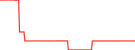
Doric Network
DRC
|
$0,06866 | 0.0% | 0.0% | 0.0% | 25.4% | $41,83 | - | $41.194.777 |
|
||||

PHPCoin
PHP
|
$0,00 | - | - | - | - | - | - | - |

|
||||

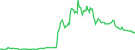
NuCypher
NU
|
$0,01275 | 1.0% | 1.1% | 13.0% | 21.0% | $50,43 | - | $49.545.207 |
|
||||

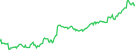
NoLimitCoin
NLC
|
$0,0003342 | 1.3% | 8.5% | 2.6% | 6.5% | $1.083,05 | - | $299.686 |
|
||||

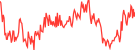
Alias
ALIAS
|
$0,04472 | 1.0% | 1.0% | 12.9% | 21.8% | $127,26 | - | $894.625 |
|
||||

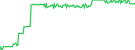
Freedomcoin
FREED
|
$0,001493 | 0.0% | 1.6% | 2.3% | 13.1% | $2.395,75 | - | $26.876,64 |
|
||||

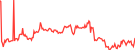
Klaytn
KLAY
|
$0,02988 | 1.4% | 0.7% | 4.5% | 31.1% | $11.290,97 | - | $193.303.438 |
|
||||

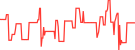
ULTRON
ULX
|
$0,00001343 | 0.0% | 17.4% | 21.1% | 38.4% | $121,36 | - | $64.277,52 |
|
||||

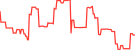
Aura Network [OLD]
AURA
|
$0,007192 | 0.0% | 0.3% | 2.1% | 18.5% | $2,02 | - | $2.971.616 |
|
||||

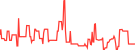
Tenup
TUP
|
$0,002538 | 0.0% | 12.4% | 23.7% | 39.1% | $703,30 | - | $144.668 |
|
||||

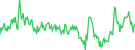
Football Coin
XFC
|
$0,006300 | 0.0% | 0.2% | 2.8% | 6.5% | $46.505,28 | - | $6.300.456 |
|
||||

Whitecoin
XWC
|
$0,002734 | 4.2% | 0.2% | 46.3% | 70.4% | $795.548 | - | $2.461.900 |
|
||||

ABBC
ABBC
|
$0,003119 | 0.0% | 0.2% | 1.9% | 11.0% | $8,18 | - | - |
|
||||

Fraxtal
FXTL
|
$0,00 | - | - | - | - | - | - | - |

|
||||

zkCross Network
CROSSAI
|
$0,00 | - | - | - | - | - | - | - |

|
||||

DOS Chain
DOS
|
$0,00 | - | - | - | - | - | - | - |

|
||||

Giant Mammoth
GMMT
|
$0,001001 | 0.0% | 4.0% | 13.7% | 9.0% | $3.388,15 | - | - |
|
||||

DeFi Kingdoms
JEWEL
|
$0,004684 | 0.9% | 2.4% | 3.3% | 10.9% | $92,39 | - | $559.449 |
|
||||

WPAY
WPAY
|
$0,9883 | 0.6% | 4.1% | 7.8% | 10.9% | $2.532.935 | - | $9.877.217.582 |
|
||||

Blast
BLAST
|
$0.065995 | 0.0% | 15.5% | 88.2% | 99.0% | $81,26 | - | $59.953,69 |
|
||||

LayerK
LYK
|
$0,05816 | 0.3% | 0.4% | 0.0% | 11.0% | $363.122 | - | $58.155.084 |
|
||||

Laïka
LAIKA
|
$0,02311 | 0.0% | 1.7% | 15.8% | 33.4% | $8.283,76 | - | $2.311.215 |
|
||||

UNIVEX
UVX
|
$0,00 | - | - | - | - | - | - | - |

|
||||

Gonka
GNK
|
$0,1599 | 6.7% | 0.0% | 0.0% | 23.8% | $901,17 | - | $69.433.627 |
|
||||

GenLayer
GEN
|
$0,00 | - | - | - | - | - | - | - |

|
||||

Meta Earth
MEC
|
$0,00 | - | - | - | - | - | - | - |

|
||||

Mixin
XIN
|
$41,57 | 0.8% | 1.1% | 8.7% | 20.3% | $17.191,01 | - | $41.569.583 |
|
||||

Oxin
OXIN
|
$0,00 | - | - | - | - | - | - | - |

|
||||

Swisstronik
SWTR
|
$0,00 | - | - | - | - | - | - | - |

|
||||

Americoin
AMC
|
$0,00 | - | - | - | - | - | - | - |

|
||||

STO Chain
STOC
|
$0,8767 | 0.2% | 0.8% | 0.6% | 3.8% | $809.718 | - | - |
|
||||

Sardis Network
SRDS
|
$0,004803 | 0.0% | 3.9% | 3.8% | 28.5% | $4,51 | - | $1.508.979 |
|
||||

Meta Finance Elements Verse
MFEV
|
$0,00 | - | - | - | - | - | - | - |

|
||||

Tangle Network
TNT
|
$0,00 | - | - | - | - | - | - | - |

|
||||

Auton
ATN
|
$0,00 | - | - | - | - | - | - | - |

|
||||

ZHC : Zero Hour Cash
ZHC
|
$0,001328 | 0.0% | 0.0% | 0.0% | 13.4% | $0,02108 | - | $398.378 |
|
||||

Cubechain
QUB
|
$0,00 | - | - | - | - | - | - | - |

|
||||

Snowman
SNOW
|
$0.0104796 | 0.0% | 19.6% | 20.3% | 31.2% | $202,56 | - | $42.633,74 |
|
||||

Siriusnet
SINT
|
$0,00 | - | - | - | - | - | - | - |

|
||||

Nengcoin
NENG
|
$0.064223 | 0.9% | 2.0% | 14.6% | 25.5% | $32,76 | - | - |
|
||||

Newton
NTN
|
$0,00 | - | - | - | - | - | - | - |

|
||||

UraniumX
URX
|
$0,7048 | 0.0% | 14.0% | 13.7% | 9.5% | $2,23 | - | $165.624 |
|
||||

BlockX
BCX
|
$0,00 | - | - | - | - | - | - | - |

|
||||

Quranium
QRN
|
$0,00 | - | - | - | - | - | - | - |

|
||||
Mostrando resultados 701 a 800 de un total de 873
Filas
Categorías Plataforma de contrato inteligente
| Nombre | 24 h | Cap. de mercado |
|---|---|---|
|
Todas las Plataforma de contrato inteligente
|
0.0%
|
$1.870.479.941.126
|
|
Capa 1 (L1)
|
0.1%
|
|
|
Proof Of Work Pow
|
0.1%
|
|
|
Proof Of Stake Pos
|
0.5%
|
|
|
Conocimiento cero (ZK)
|
2.6%
|
|
|
Capa 2 (L2)
|
0.6%
|
|
|
Privacy Blockchain
|
0.5%
|
|
|
Layer 0 L0
|
4.9%
|
|
|
Superchain Ecosystem
|
1.1%
|
|
|
Sidechain
|
0.0%
|
|
|
Gaming Blockchains
|
1.0%
|
|
Gráfico de cap. de mercado de los principales sectores de Plataforma de contrato inteligente
El siguiente gráfico muestra la capitalización de mercado y el dominio en las subcategorías Plataforma de contrato inteligente, entre ellas Capa 1 (L1), Proof Of Work Pow, etc. durante un periodo de tiempo.
Gráfico de rendimiento de los mayores sectores de Plataforma de contrato inteligente
El siguiente gráfico muestra el rendimiento relativo de las subcategorías Plataforma de contrato inteligente a lo largo del tiempo. Pare ello, tiene en cuenta sus ganancias y pérdidas porcentuales en términos de capitalización de mercado en diferentes periodos.
Últimas noticias de Plataforma de contrato inteligente

 ETH


 BTC





 O búsquela en las tiendas de aplicaciones


