
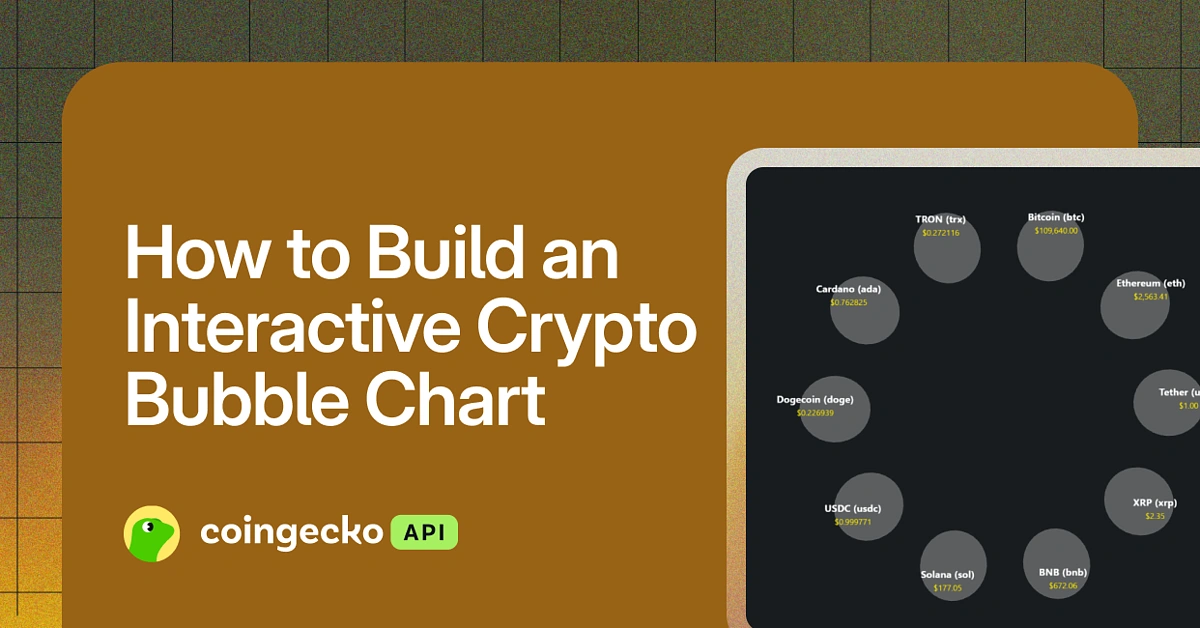
This guide demonstrates building a crypto market visualisation tool using the CoinGecko API for market data and Three.js with React for interactive 3D graphics. The focus is on integrating real-time data pipelines, rendering 3D elements efficiently, and providing a responsive user interface for analysing cryptocurrency trends.
Prerequisites
Before we begin, ensure you have the following:
-
CoinGecko API: Fetch market data for cryptocurrencies, especially the endpoint /market and /market_chart. The free Demo plan is enough for our needs, with a rate limit of 30 calls per minute and a monthly cap of 10,000 calls. Create a Demo account to try it out.
-
Node.js: Download and install the latest stable version from the website, if not installed already.
-
Visual Studio Code (VS Code): Download and install Visual Studio Code from the website. Keep it updated to get the latest features and extensions.
-
React & JavaScript Familiarity: A basic understanding of React and JavaScript will help you navigate the code.

Setting Up a React App and Three.js
-
Create the React App: Open your terminal. Then, create a new React application by running the following command:
npm create vite@latest my-app --template react
-
Launch the Boilerplate: Open the project in your preferred code editor, such as Visual Studio Code. Before making any changes, verify that everything is set up correctly by running:
npm install npm run dev
-
Install Three.js: To integrate advanced 3D rendering capabilities into your app, install Three.js by executing: npm install three
1. Rendering Market Data with Three.js
With Three.js installed, we’re ready to build our first basic 3D scene. In your src folder, create a new file called ThreeScene.jsx. In this file, set up the foundational elements:
-
Initialise the Scene: Create a Three.js scene.
-
Set Up the Camera: Configure an Outlook camera tailored to our needs.
-
Create the Renderer: Attach a WebGL renderer to your DOM.
-
Add a Simple Cube: Render a basic cube, which you can later expand into more complex market data visualisations.
This setup provides the groundwork for integrating real-time crypto market data.
Creating the 3D Scene with Three.js
We created a new React component called ThreeScene.jsx. This component is responsible for setting up and managing the 3D environment, including the scene, camera, renderer, and visual elements. Here's a breakdown of the key parts:
1. Setting Up the Scene
const scene = new THREE.Scene();The scene is the foundation of the 3D world. It acts as a container for all the objects (like cubes, spheres, or lights) that will be rendered. Think of it as the stage where everything happens.
2. Configuring the Camera
const camera = new THREE.PerspectiveCamera(

  75,

  window.innerWidth / window.innerHeight,

  0.1,

  1000

);

camera.position.z = 10;
The camera determines what part of the scene is visible to the user. Here, we use a perspective camera, which mimics how the human eye perceives depth. By positioning the camera slightly away from the centre along the Z-axis, we ensure that objects in the scene are visible.
3. Initialising the Renderer
const renderer = new THREE.WebGLRenderer();

renderer.setSize(window.innerWidth, window.innerHeight);

document.body.appendChild(renderer.domElement);
The renderer is the object for drawing the scene onto the screen using WebGL. We set its size to match the browser window and append its canvas element to the DOM so that the 3D content is displayed.
4. Animating the Scene
The animation loop is what makes the scene dynamic and interactive. It continuously updates and re-renders the scene:
const animate = () => {

  requestAnimationFrame(animate);

  renderer.render(scene, camera);

};

animate();
This loop ensures that any changes to the objects (like rotation or movement) are reflected in real-time. For example, if you add a rotating cube, the loop will keep updating its position.
5. Cleaning Up
React components can be mounted and unmounted multiple times during the app's lifecycle. To prevent memory leaks, we clean up the renderer when the component unmounts:
return () => {

  document.body.removeChild(renderer.domElement);
};
This ensures that the WebGL context and DOM elements are properly disposed of when the component is no longer in use.
When I first set up the 3D scene, I ran into an issue where the canvas wasn't resizing properly when the browser window was resized. To fix this, I added an event listener to handle window resizing and update the camera's aspect ratio and renderer size dynamically:
window.addEventListener("resize", () => {

  camera.aspect = window.innerWidth / window.innerHeight;

  camera.updateProjectionMatrix();

  renderer.setSize(window.innerWidth, window.innerHeight);

});
This small addition made the app much more user-friendly and responsive.
2. Integrate Market Data
Next, let's fetch market data from the CoinGecko API. Install Axios for making API requests:
npm install axiosCreate a fetchMarketData.js file inside the src folder:
3. Link Market Data to Three.js
Modify ThreeScene.jsx to use market data. Now that we've set up a basic 3D scene with Three.js, it's time to enhance it by integrating real-time market data from the CoinGecko API. This will ensure that our visualisation dynamically reflects live cryptocurrency trends.
export default ThreeScene;
4. Visualising the 3D Spheres
Once we have the data, we loop through each coin and create a 3D sphere to represent it:
marketData.forEach((coin, index) => {

  const size = Math.cbrt(coin.market_cap) * 0.0001;

  const geometry = new THREE.SphereGeometry(size, 32, 32);

  const material = new THREE.MeshBasicMaterial({ color: 0xffffff });

  const sphere = new THREE.Mesh(geometry, material);


  sphere.position.x = (index - marketData.length / 2) * 2;

  scene.add(sphere);

});
How to Run the Program
-
Install Dependencies: Ensure you have Node.js installed. Then, go to the project directory in your terminal window and run the following npm command to install all required dependencies:
npm install -
Start the Development Server: Run the following command to start the development server:
npm run dev -
Access the Application: Open your browser and navigate to the URL displayed in the terminal (usually
http://localhost:5173for Vite projects).
Output
Once the program is running, you should see:
Note: If there are issues fetching data, an error message will be displayed on the screen.
Future Enhancements
-
Add Interactions: Use raycasting to detect mouse hover over coins. Fetch additional details like trading volume, circulating supply, and all-time high using the CoinGecko /coins/{id} endpoint. Display this data dynamically in a tooltip for better user insights.
-
Animate Live Updates: Poll the CoinGecko /simple/token_price/{id} endpoint every minute to fetch updated prices and percentage changes. Reflect changes visually by animating sphere colours or sizes based on price movements.
-
Integrate Historical Data: Use the CoinGecko /coins/{id}/ohlc endpoint to fetch OHLC (Open, Low, High, Close) data—Visualise trends with animations or graphs, such as a pulsing effect for coins with significant price volatility.
Real-World Examples: Crypto Projects Using CoinGecko API
While this guide walks you through the basics of building a crypto bubble chart, several projects are already using the CoinGecko API to power their market visualization tools at scale. Let's take a look at some examples:
Crypto Bubbles
Crypto Bubble uses /market and /market_chart to fetch price and market data, turning it into an interactive bubble UI that quickly lets users grasp market performance trends.
Today's featured project that's built with our API is none other than incredible visualization tool @CryptoBubbles 🫧👇https://t.co/9wLOorBM5W #BuildwithCoinGecko pic.twitter.com/2BRMWXv83E
— CoinGecko (@coingecko) August 7, 2023
Banter Bubbles
Similar to Crypto Bubbles, Banter Bubbles features an interactive bubble chart of the crypto market, but with additional data points like FDV and Circulating Supply, along with better category-based segmentation. All of this is powered by data from the /coins/{id} endpoint.

Conclusion
This project demonstrates leveraging Three.js and the CoinGecko API to build a real-time bubble crypto chart visualisation tool. By integrating CoinGecko's endpoints for market data and historical trends, we created interactive 3D spheres representing cryptocurrencies, with live updates and performance optimisations like instanced meshes. The tool uses raycasting for user interactions and visual cues like colour changes to indicate price movements. This setup provides a scalable, efficient, and visually intuitive way to analyse crypto market data in real-time.


 Or check it out in the app stores

