
Memecoin launchpads such as Pump.fun, Raydium, and Meteora DBC operate at extreme speeds. In this environment, a few seconds can be the difference between finding early profit opportunities and becoming exit liquidity. For developers building trading bots, dashboards, or security tools, this velocity creates both opportunity and a serious technical bottleneck. Tracking launches across different platforms requires combining inconsistent data sources and maintaining complex infrastructure that often breaks whenever a platform updates its API.
The CoinGecko API solves this fragmentation by providing a unified gateway to standardized bonding curve data across all major memecoin launchpads, enabling developers to retrieve real-time graduation metrics, price progression, and liquidity data with a single API request. In this guide, we'll use Python and the CoinGecko API to fetch bonding curve data, build email-based graduation alerts, and create a Streamlit dashboard for tracking token launch progress. Keep reading to learn more.
Disclaimer: This guide is for educational purposes only and should not be considered financial advice. Always do your own research.

What is a Bonding Curve in a Crypto Launchpad
In a crypto launchpad, a bonding curve is a mathematical formula that dictates a token's price based on its current supply. As buyers mint new tokens, the price rises along the predefined curve; as sellers redeem tokens, the price decreases. This mechanism replaces traditional order books, enabling automatic price discovery and instant liquidity for new memecoin launches without requiring external market makers.
While all bonding curves primarily link supply to price, their mathematical formulations vary widely which can lead to different price behaviors, investor incentives, and trading risks.
Common examples include:
-
Linear Bonding Curve
Price increases at a constant rate for every token purchased.
Example:Price = a · Supply + b
These are simple, predictable, and easy to model, but can make early tokens disproportionately cheap compared to later ones. -
Exponential Bonding Curve
Price grows multiplicatively, causing steep increases as supply rises.
Example:Price = a · e^(k · Supply)
These curves reward early buyers significantly and create rapid price acceleration as demand from new buyers kicks in. -
Logarithmic Bonding Curve
Price grows sharply in the beginning, then gradually flattens into a gently rising slope.
Example:Price = a * ln(Supply + 1)
These are more suited for governance tokens. -
Sigmoid/Logistic (S-shape) Bonding Curve
Price starts near zero, accelerates through a "takeoff" region at the midpoint, then asymptotically approaches a ceiling price (L) without exceeding it.
Example:Price = L / (1 + e ^ (-k * (Supply - x0)))
These curves are commonly used in reputation systems, social tokens, and experimental launchpads that want to reward early participation while capping maximum price exposure.
Regardless of the formula, the principle remains the same. A bonding curve encodes the entire lifecycle of the token’s early market behavior. As a result, traders and developers can infer how price, liquidity, and market depth evolve as buying pressure increases.
However, each launchpad implements unique curve designs, supply thresholds, and graduation conditions. This affects how price is calculated, when liquidity migrates to a DEX pool, and how early buyers are incentivized. For developers tracking tokens across platforms, this fragmentation requires reverse-engineering contract logic, querying incompatible endpoints, and normalizing data for dozens or hundreds of launches per hour.
Leveraging the CoinGecko API eliminates the need to reverse-engineer these disparate mechanics. Developers access a standardized, real-time feed of bonding curve and graduation data across all major launchpads through a single schema, dramatically reducing complexity and minimizing infrastructure maintenance.
Why is Tracking Bonding Curve Data Important
For traders and bot developers, tracking bonding curve data reveals exactly where a token sits in its launch lifecycle, enabling precise entry and exit timing, early detection of manipulation, and data-driven risk modeling. In a market where seconds can determine profit or loss, this visibility provides a meaningful competitive edge.
Identifying Early Entry and Exit Opportunities
In the early phase of a bonding curve, prices rise slowly, offering accumulation opportunities before broader liquidity arrives. As the curve steepens, late-stage FOMO-driven demand signals potential exit zones before graduation to an AMM or the first major sell-off. Knowing a token's precise curve position enables informed decisions rather than guesswork.
Detect Market Manipulation
Because bonding curves tie price directly to supply, any irregular movement, whether a sudden jump in minted tokens, abnormal buy bursts, or hidden liquidity injections, becomes immediately visible when supply and price data are tracked together. This makes bonding curve analysis a powerful tool for detecting potential exploits or insider activity that would remain invisible on a standard price chart. Developers building anti-bot or anti-manipulation systems can use this data to automate alerts and flag suspicious behavior in real time.
Build Trading Models and Risk Profiling
Historical bonding curve data enables systematic backtesting across different curve shapes and market conditions. Steep exponential curves indicate high volatility; gradual linear curves suggest predictable supply distribution. This allows quants and bot developers to model risk, simulate outcomes, and optimize execution logic, forming a data-driven framework for evaluating new launches.
How to Get Bonding Curve Data for Any Launchpad Token
Standardized bonding curve data for tokens on many supported launchpads are available via CoinGecko's on-chain API endpoints, which return key metrics like graduation percentage and migrated pool addresses. CoinGecko supports bonding curve data for the following launchpads:
-
Raydium launchlab (including LetsBonk.fun launchpad tokens).
Developers can access the following CoinGecko API on-chain endpoints to get bonding curve data:
Let’s dive into a few practical examples using Python.
Prerequisites
We will make use of a Jupyter notebook as our primary development environment. Additionally, the following packages need to be installed.
pip install pandas
Pandas is a popular DataFrame library, which we will use to save bonding curve data.
We will also import several packages throughout this guide. You can add these to the top of your Python script or Jupyter notebook cell:
import pytz
import duckdb
import time
import requests as rq
import json
from datetime import datetime
To start coding in a new notebook, execute the following command in the terminal:
jupyter lab
This should open up a new tab in a browser. To get a head start, you can clone the complete notebook from the GitHub repository and open it in your Jupyter environment. Remember to replace the placeholder for the API key with your own.
CoinGecko API key
To access the API endpoints, you will need at least a Demo API key. If you don't have one, read this guide on how to get your free Demo API key. While most examples in this guide use the free Demo API, some advanced features, and access to exclusive endpoints require a paid API plan.
Setting Up the API Access
In order to have our environment set up for secure API access, we can save the keys locally to a file and read from there whenever needed. The use_demo (or the use_pro for paid API plans) header is used in the get_response function, which will make the request for us. Status code 200 indicates that the request was successful. In case we get a different code, the function also throws an error.
The base URLs for the public Demo API and the Pro API are assigned to the following variables:
PUB_URL = "https://api.coingecko.com/api/v3"PRO_URL = "https://pro-api.coingecko.com/api/v3"Since we will be using multiple API endpoints throughout this guide, let's create a helper function that dynamically generates the appropriate URL based on the endpoint type and parameters.
Get Bonding Curve Data for a Specific Pool Address
Using the CoinGecko API's /onchain/networks/{network}/pools/{address} endpoint, you can retrieve bonding curve data for any launchpad pool. This includes graduation percentage, completion status, and migrated pool address. This data is available only for pools linked to supported launchpads, not regular DEX pools.
The API response for a launchpad pool address will include a section called launchpad_details. This is also visible in the parsing logic below.
Pre-Graduation Pool Example
Using the above function with a sample Raydium LaunchLab pool address "T3Awfn8D8jVbT4wGBKNnBntRfj7PQVWe8J7zQH4FQzM" on the Solana network (as of December 30, 2025), we get the following response:

The graduation percentage can also be validated on the relevant Geckoterminal page (~ 18% for this example).
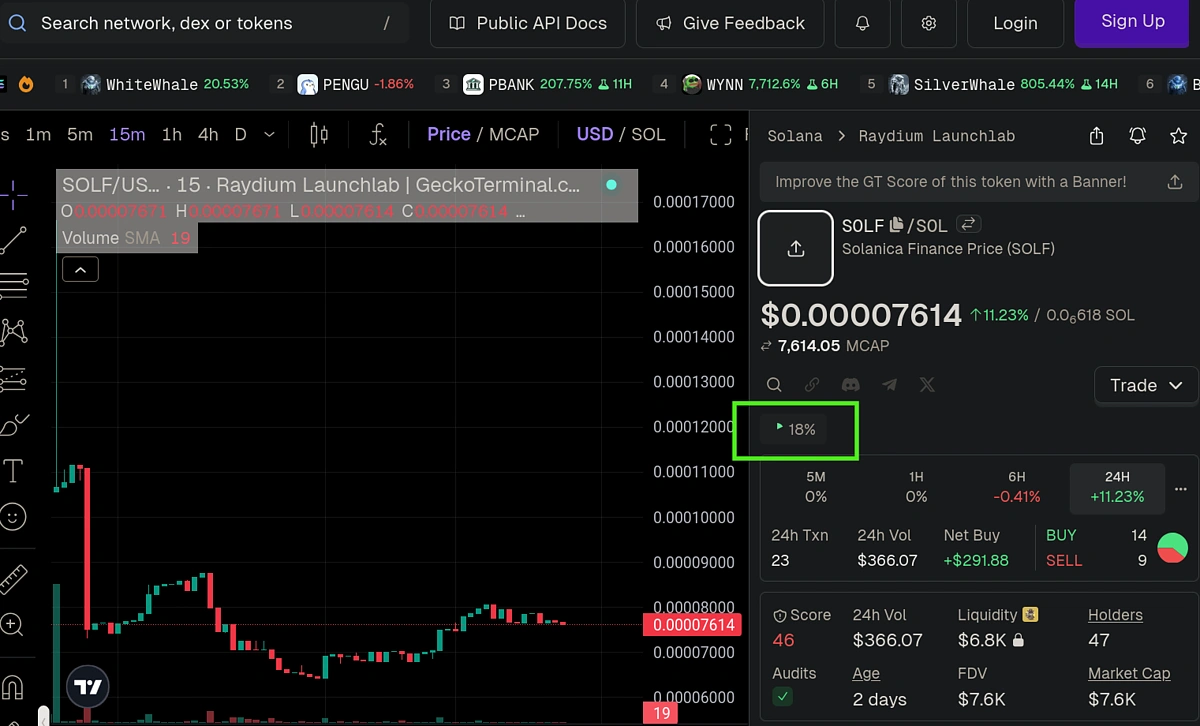
During the bonding curve phase, the pool address represents the bonding curve contract itself. This is where buys and sells are executed, price is calculated based on supply, and liquidity is programmatically managed.
Post-Graduation Pool Example
Once a token graduates, liquidity is migrated to a DEX pool and a new pool address is created for that token. This migrated address is returned in the migrated_destination_pool_address field.
Let's examine a graduated pool (6F4VfEsibTcxJPKRBQ5V8E4jvSJDS14cDs1g2xApNDX4) where the token has completed its bonding curve. The API response looks like the following with the destination pool address highlighted in green:

This can easily be validated on Solscan:
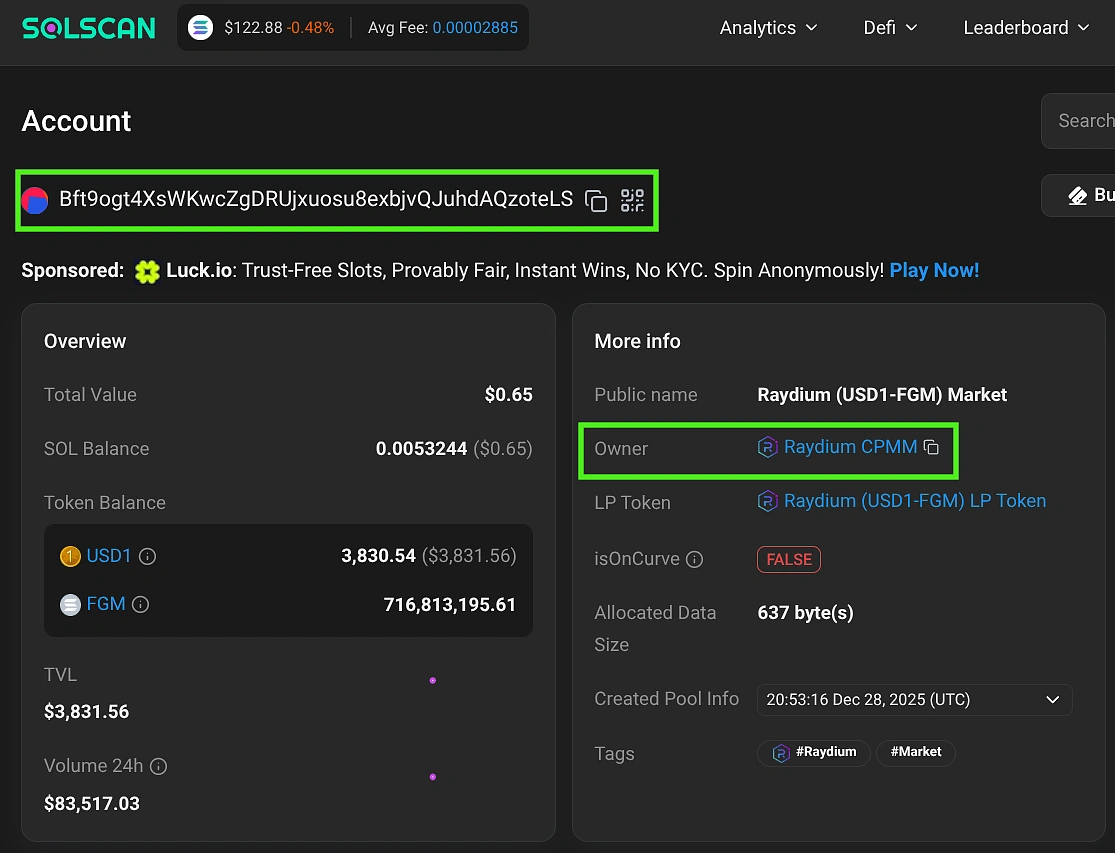
The migrated_destination_pool_address tells you exactly where the token's liquidity now resides. Once graduation occurs, the original bonding curve pool becomes inactive and all trading activity moves to this new DEX pool. Knowing this address allows you to continue tracking the token's price, volume, and liquidity in its new location.

Get Bonding Curve Data for a Specific Token Address
If you know the token address but not the pool address, you can use the CoinGecko API's /onchain/networks/{network}/tokens/{address} endpoint to retrieve the same bonding curve data. This is useful when you are tracking a specific token across its lifecycle or when the pool address is not readily available to you.
The endpoint returns the same launchpad_details fields covered in the previous section, including graduation percentage, completion status, and migrated pool address. The parsing logic below extracts these fields from the API response:
Let's test this with a sample token from Raydium LaunchLab using the token address “4FkUfLMkGMHzUCCzzS9wnqyFaL6WqXmUTEBqJGpobonk”:

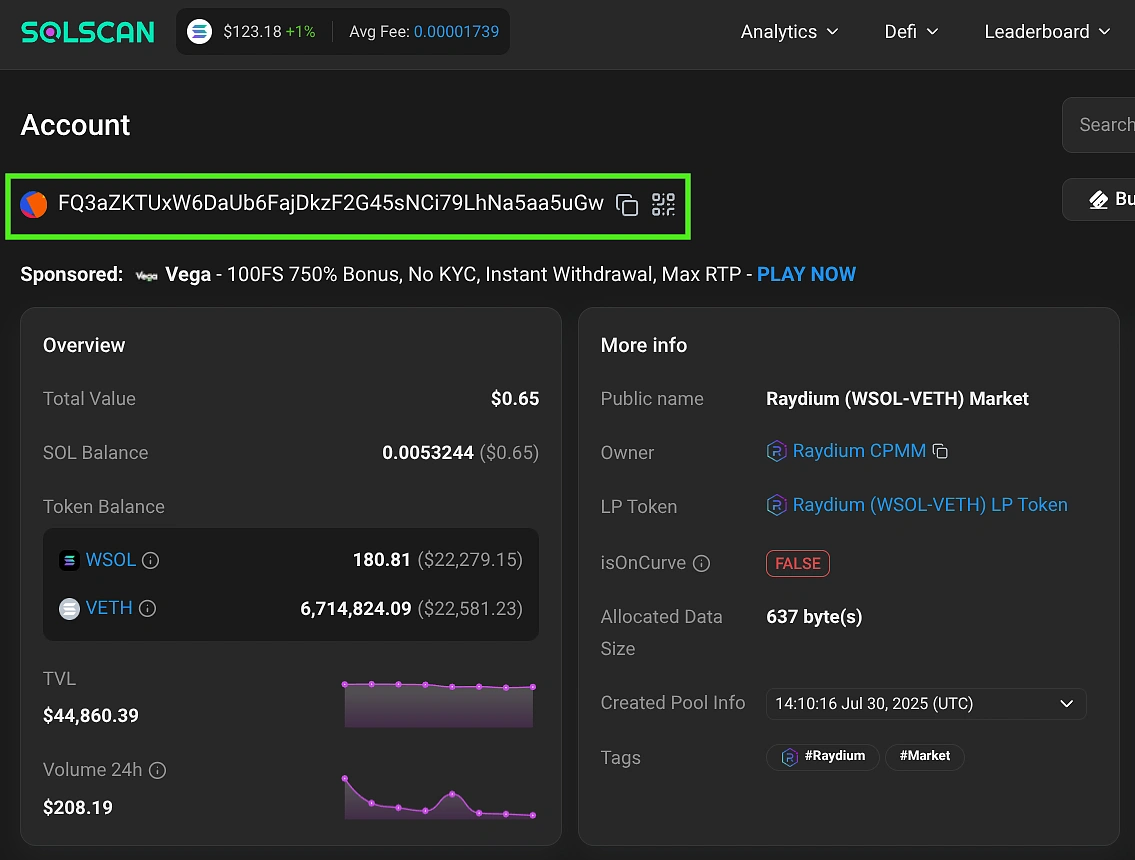
The bonding curve progress for this token is 100% since it has already graduated. Running our code with this token address, we get the following response via the API.

Additionally, we can also verify if the destination pool is correct by checking the address details on Solscan.
What Can You Build With Bonding Curve Data?
Developers can leverage real-time bonding curve data using CoinGecko API to build powerful, automated tools including graduation alerts, analytics dashboards, trading screeners, market research reports, execution bots, and full backtesting systems. Let’s look at some practical examples along with the relevant code snippets.
How to Build a Launchpad Token Graduation Alert
Using CoinGecko API's graduation data, you can trigger alerts via email, Telegram, Discord, or webhooks when a token approaches its graduation threshold. This enables bots and dashboards to react instantly to critical lifecycle events.
Below, we extend the token data logic to apply a threshold (e.g., 95%) and send email notifications when graduation is imminent.
The above function can be used to return data for a list of tokens as shown below.
|
|

We can see that two of the tokens have already graduated and also have an associated destination pool address. This is a critical data point for developers, as it marks the exact moment to switch bot tracking from the bonding curve to the DEX pool.
To receive alerts via email, you'll need a Gmail app password. Set this up as follows:
-
Go to Google Account settings
-
Navigate to Security
-
Enable 2-Step Verification
-
Select App passwords
-
Enter a name and click Create
Store the password in a separate file rather than hardcoding it. The example below uses a dummy sender address ([email protected]).
|
|
The send_email function below filters out tokens for which graduation is complete. The html_body ensures that the email content is formatted as a table.
We can now execute the email alert logic for the list of tokens defined earlier.
send_email(list_of_tokens, "solana", 95)
The alert email will be received in the format as shown below:

How to Create a Token Launch Progress Dashboard
To track tokens at scale, use the CoinGecko New Pools List endpoint to discover the latest launches across all supported launchpads. Enriching this data with graduation details forms the basis of a launch progress dashboard.
The following function extracts network IDs and token addresses for tokens sorted by market cap, cycling through multiple API pages and combining results into a single dictionary.
Cycling through the list of tokens + network ID’s returned from the above function, we can create a single DataFrame consisting of all the data concatenated together.
To select the top 200 entries sorted according to market cap in USD, we can execute the function:
df_all_status = track_status_all("market_cap_usd", 200)
To keep our dashboard simple, let’s track only those tokens with a graduation percentage between 5 and 50.
|
|
This can be saved to a DuckDB database on disk. This step is necessary since we want to run the tracking logic and save the results for the same set of token + network ID’s.
To read back and validate the data that we just saved, use the following logic:
|
|

To track how graduation percentage changes over time (curve velocity), you'll need to store the data at regular intervals. The following code saves graduation data to a DuckDB database every 5 minutes, enabling historical analysis.
The above logic needs to be run periodically. For this example, we are writing to the database every 5 minutes.
Now that we have the token progress data saved, it’s time to visualize it as a dashboard. We will make use of the popular Streamlit library. Since we need to start a separate server to run the dashboard app, we will switch to VS Code as the development environment. It will be helpful to create a separate Python environment to install and manage dependencies. Make sure you have Python installed and then from the terminal execute:
python3 -m venv .venv
This will create a new folder .venv where the files for the virtual environment will be saved. Activate your environment with one of the following commands, depending on your operating system.
# Windows command prompt
.venv\Scripts\activate.bat
# Windows PowerShell
.venv\Scripts\Activate.ps1
# macOS and Linux
source .venv/bin/activate
Now install the following packages: streamlit, duckdb, pandas, altair
pip install <package name>
For our dashboard page, we want to read the graduation data and display it as a table. Furthermore, we can plot the graduation percentage over time using the “timestamp” column that we had added earlier. For this example, I left the database update logic (every 5 minutes) running overnight.
Start the Streamlit app with: python3 -m streamlit run app.py
This opens a browser window displaying an interactive data table with historical graduation metrics and a configurable line chart showing graduation progress over time. The table supports CSV export and token filtering.
Conclusion
The memecoin launchpad ecosystem is highly fragmented, with each platform implementing unique bonding curves and graduation mechanics. The CoinGecko API simplifies this complexity by providing unified, real-time access to bonding curve and graduation data across all major launchpads.
By abstracting away platform-specific logic, the API helps developers save significant development time and infrastructure costs, while giving traders and analysts the data they need to gain a real competitive edge at scale. In this tutorial, we learnt how to implement the API logic and explored how to set up additional developer-friendly customizations.
Most of the endpoints we covered in this guide are accessible via the free Demo API plan. For higher rate limits, extended historical data, and exclusive endpoints suited to quantitative research or algorithmic trading, consider subscribing to a CoinGecko API paid plan.


 Or check it out in the app stores

