Key Takeaways
-
Divergence in trading refers to a discrepancy between an asset’s current price actions and the momentum indicator patterns. They often suggest a significant change in the course of price development.
-
Classic indicators are indicators of a change in the trend for the concerned assets. They can be bullish or bearish.
-
In a classic bullish divergence, the asset’s price continues to make lower lows while the momentum indicators print higher low patterns. Classic bearish divergence is identified by continuous higher high price patterns and lower highs patterns by the momentum indicator.
-
In contrast, hidden divergences suggest a continuation of the dominant trend for an asset.
-
Hidden divergences are either bearish or bullish. Hidden bullish divergence is characterized by higher lows for the asset price and lower lows for the momentum indicator.
-
Hidden bearish divergence is indicated by lower highs for the asset price and higher highs for the momentum indicator.

Traders apply metrics from trading analytic tools and applications in several ways. These analytic tools are designed to be flexible and mathematically accurate, while the price patterns show statistics and present graphic prints of the asset’s price development course.
In addition, trading analytic platforms also have tools for estimating market sentiments and momentum, and these are known as momentum indicators or oscillators. The statistics they present give a better understanding of the current price development and also a hint at the asset’s next move.
What is Divergence?
Momentum indicators or oscillators are mathematically derived metrics and patterns that estimate the probability that an asset’s price continues in its usual direction or changes the trend. It estimates the strength of an asset as the price develops and shows the strength of the market relative to the value developments of an asset.
As a rule of thumb, these two should correspond. That is, the value of an asset is supposed to go up when the market sentiment is moving strongly and positively ( an uptrend). On the other hand, the value of an asset is also expected to drop when the market strength (momentum) is dwindling. From the charts, in a bullish market, the oscillator should show higher highs while the asset price shows higher highs as well. The oscillator and the price should also show lower lows when the market is bearish.
This, however, is not always the case. When this happens it is called a divergence and could be suggestive of an important development.
Divergence indicates a discrepancy between the current price actions of an asset and the momentum indicators or oscillators. In the event of a divergence, the patterns developed by the asset’s price actions and the momentum indicators are in disagreement.
Cryptocurrency traders utilize divergence patterns in their routine trading by employing momentum indicators like RSI (Relative Strength Index) and MACD. The divergence patterns encountered more often are the regular divergence patterns (also known as classic or standard divergence patterns), and the relatively less often seen, hidden divergences.
What is Regular (or Classic) Divergence?
Classic divergence occurs when the asset continues to make higher highs while the momentum indicator pattern continues to develop lower highs, or when the price makes lower lows while the momentum indicator pattern develops higher lows. The latter is known as a bullish divergence while the former is known as a bearish divergence.
Classic divergence suggests a change in trend price development as the momentum indicators suggest that the market strength is changing despite the price continuing in its course.
Bullish divergence suggests a reversal from a price drop. It shows the market momentum building towards an uptrend as the asset approaches a new bottom.
Bearish divergence is the opposite. The momentum indicator signals the market strength weakening while the asset continues to move up in price. In most cases, this could mean that the momentum is slowing.
Divergences are not always as straightforward as the classical or regular types, which brings us to hidden divergences.
What is Hidden Divergence?
Hidden divergences are less obvious, and it might take added experience to recognize a hidden divergence.
In the event of a hidden divergence, the asset’s price reached higher lows and higher lower hands while the momentum indicators print lower lows and higher highs respectively. Like regular divergences, hidden divergences can be bullish or bearish.
Bullish hidden divergences are characterized by the asset’s price showing higher lows while the momentum indicators patterns show lower lows. Bearish hidden divergences are characterized by lower highs for the asset’s value while the momentum indicator patterns show the momentum growing, creating higher highs.
Hidden vs. Regular Divergence
Regular divergence is a classic deviation from the course of an asset’s price development. When the momentum and price action are not in congruence, it basically implies that the market sentiment is moving in a different direction and signals a change in the trend. In comparison, a hidden divergence brings in a twist. When bullish, the oscillator and the asset’s price print new lows, but the oscillator prints lower lows (showing the market sentiment nearing its bottom) while the asset continues to create new lows which are higher than the previous. The reverse is the case for bearish hidden divergences.
While the classical divergence is presumed to signal the end of a trend, the hidden divergence is regarded as a signal that the asset’s value is likely to continue in its dominant course. That is, a bullish hidden divergence signals that the price will continue to go up after a brief sell-off, while a bearish hidden divergence signals that the price will continue to drop after a brief attempt at recovery.
Bearish Hidden Divergence
As described earlier, in a bearish hidden divergence the asset price shows lower highs while the oscillator shows higher highs. This indicates that the asset is struggling to maintain its support levels even when the market sentiments are growing. Analytically, this implies that the growing sentiment is not enough to break through the resistance levels, and the downtrend is poised to continue when the momentum slows.

The chart above is selected from the WMATIC/USDC pair on the Polygon blockchain, which shows a hidden bearish divergence between the opening price on March 9th and about eight hours into the daily trading periods for the said pair.
The chart returns to a downtrend as the oscillator returned to lows.
Bullish Hidden Divergences
Assets whose price is in an uptrend usually experience a brief sell-off, and if the momentum is strong enough, the price is expected to continue going even higher after the sell-off. In some cases, the charts print a proper bullish hidden divergence pattern. This is characterized by higher low patterns for the price chart as the price recovers strongly from each sell-off and lower low patterns for the oscillator as the momentum hits bottom levels. The asset’s price is poised to continue going up once the momentum recovers from bottom levels.

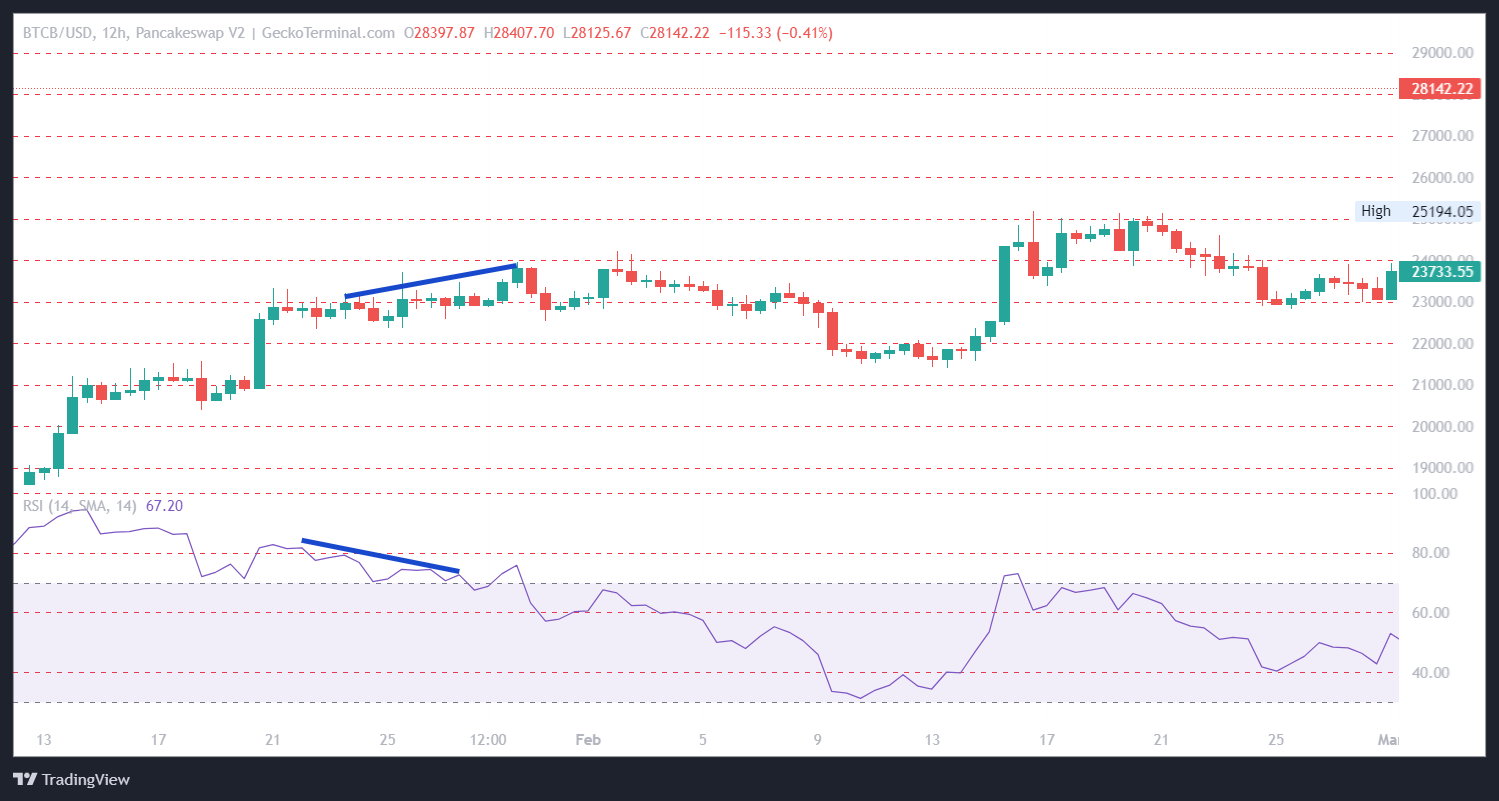
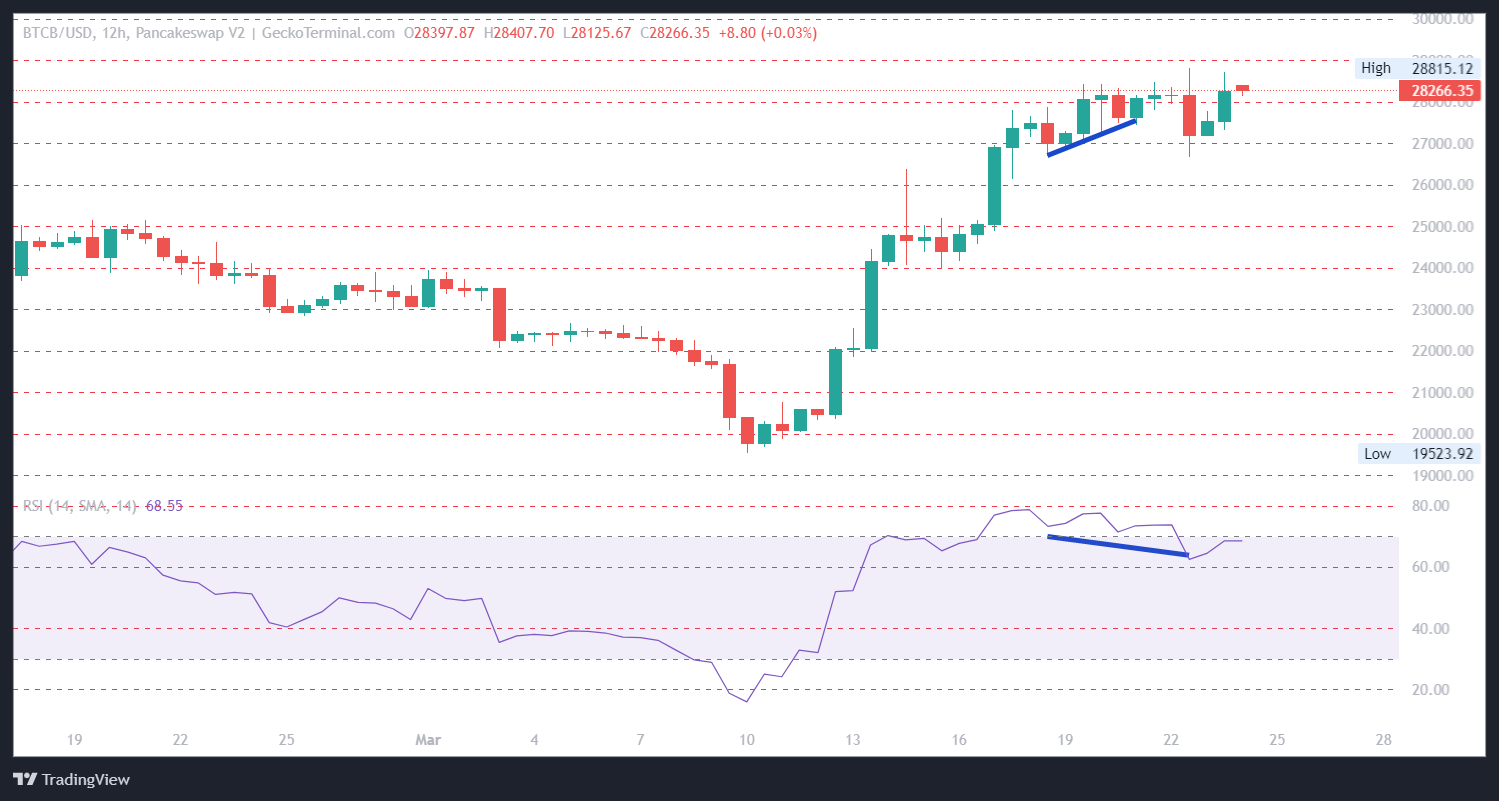
The BTC/BUSD chart above shows a hidden bullish divergence as bitcoin experiences a sell-off around the $27,000 region. The RSI pattern signals that the market sentiments are at new lows while the price holds its support levels strongly and continues to recover at higher levels. Bitcoin’s price soars above $28,000 as the momentum recovers from the low levels.
How to Identify Hidden Divergences With Momentum Indicators
Momentum indicators are a good measure of market sentiments. At base levels, they present their statistics by collating the market trends over a period of time and mathematically translating this into a numerical measure of the market strength and presenting this in graphics through charts. The most commonly used indicators for identifying divergences are the RSI and MACD.
RSI (Relative Strength Index)
The RSI of an asset is usually calculated on a daily basis and considers the previous closing level of an asset. The Relative Strength of an asset is the ratio of the number of days it closed on a high against the number of days it closed on a low. The relative strength is used to derive the relative strength index.
An RSI of 70 and above is indicative of high strength and a high probability that an asset pursues or continues in a positive price development path. An RSI of 30 and below shows a relatively weak asset and is indicative of the asset being overbought. The price of an asset at an RSI of 50 is popularly regarded as its support level or resistance level, within this level the RSI and the price could swing towards weak or strong levels.
The RSI signal uses the price troughs formed by the single signal line to detect the divergence between the price and momentum. To identify a hidden divergence using the RSI. First, set up the RSI, by visiting http://geckoterminal.com. Search for the token. Click "Indicators" and search for “Relative Strength Index”.
Apply the RSI to your chart and watch out for points where any of the charts (RSI and asset price) deviate from the normal trend.
The chart shows the RSI moving in a different direction, relative to the price. The deviation is usually identifiable with a common view, however, you can use the line tool to connect the candles for a better understanding of the depression or elevation. Higher levels show elevation while lower levels show depression.
MACD (Moving Average Convergence/Divergence)
The MACD helps to identify stages in price development where trends are accelerating. When an asset is moving up in price, the MACD helps to identify the levels where an even longer green candle might appear. The MACD is calculated by subtracting the 26-period EMA (Exponential Moving Average) from the 12-period EMA.
The 26-period EMA represents the long-term EMA while the 12-period EMA represents the short-term EMA. When both EMAs are subtracted, the result is the MACD line. The MACD line is plotted alongside the 9-day EMA of the MACD line. The 9-day EMA of the MACD line is known as the signal line. Both lines when plotted together (signal line above the MACD line), can serve as an indicator for buy and sell signals.
The lines of MACD interception with the asset’s price are indicative of a high chance that the asset moves with a higher intensity in its uptrend or downtrend. The MACD can also indicate bullish and bearish divergences.
To identify a hidden divergence using the MACD, first set up the MACD indicator, by visiting http://geckoterminal.com. Search for the token you wish to trade and click "Indicators, then search for “MACD” and apply the MACD indicator to your chart. The MACD signal uses the point of the cross between the MACD lines and the peaks of the MACD line in the indicator window as the reference signal from the oscillator.
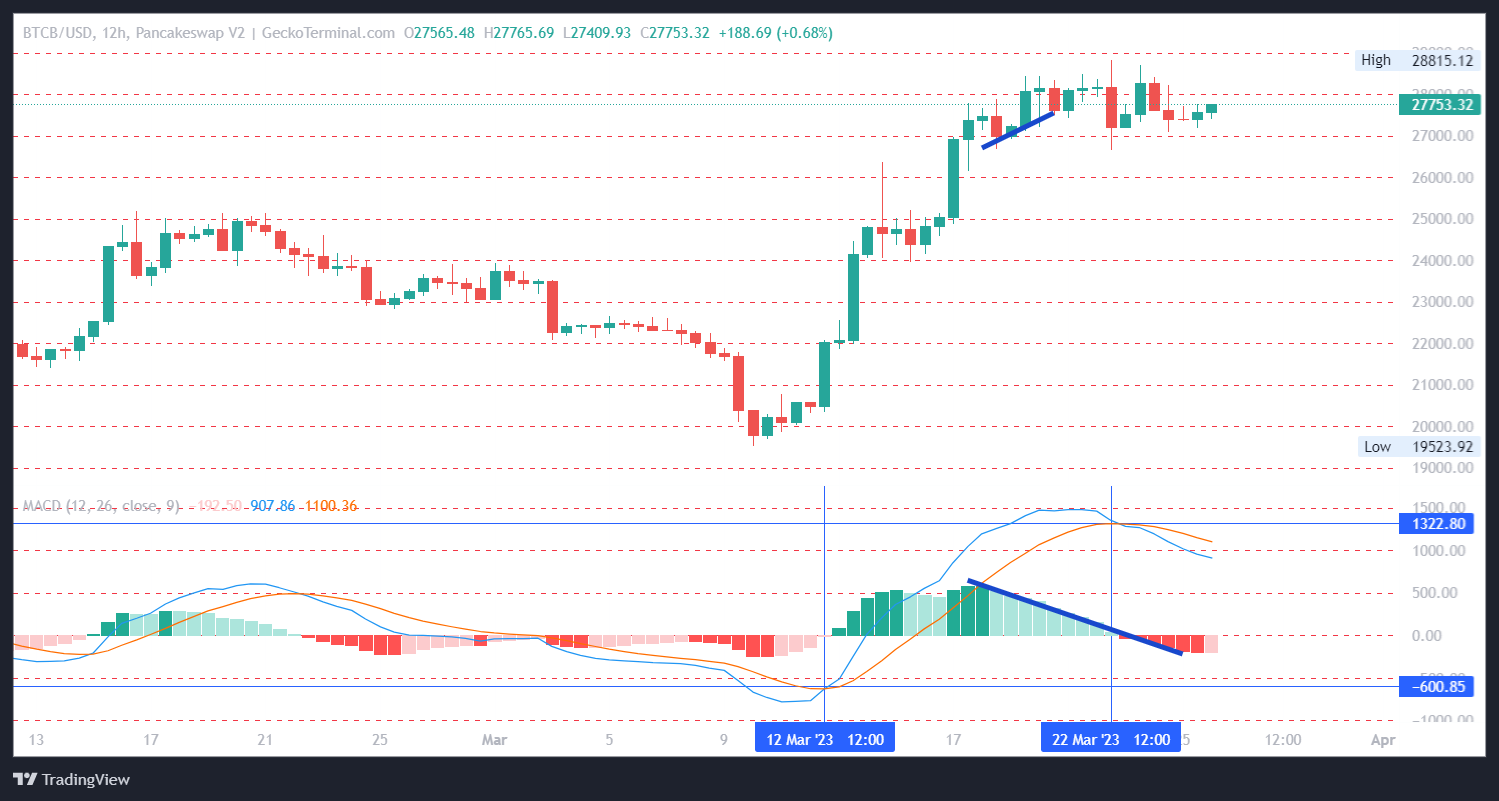
The chart above was drawn from the BTC/BUSD pair. It shows the points of cross between the MACD lines and peaks of the MACD line in the indicator window. The chart shows a hidden bullish divergence.
How to Apply Hidden Divergence in Technical Analysis
Before a trader or a long-term investor makes a trade decision, a couple of things must be considered. These include the current trend for the asset and whether this trend will continue or end before or at a certain time, these are influenced directly by the market strength. Identifying a divergence pattern is a good way to mathematically determine the fate of the asset.
A trader hopes to make a profit by either buying an asset before it goes up in value, or selling an item at peak prices and buying again when the market pulls back. Hidden divergences offer traders a way to determine if the market is only experiencing a brief sell-off by older investors or crashing due to poor sentiments.
If the hidden divergence is bullish, then there is a higher chance that the market is bound to recover and continue in its uptrend. The decision to be here depends largely on the trader. While a couple of traders will DCA at the low levels and hope to make more returns when the uptrend continues, others might want to hold on to their portfolio and sell later. Derivatives traders might also decide to take a long position or close their short positions to avoid getting liquidated.
For a bearish hidden divergence, the options for older holders are to either sell before the downtrend continues, or buy more at even lower prices. Derivatives traders might decide to take a short position or close their long positions to avoid getting liquidated.
Final Thoughts
Divergences on trading charts don't occur frequently, but when they do, they can signal an abrupt change in trend. Analyzing these divergences can increase the chances of making a correct decision, but it's important to remember that no analysis can guarantee success. One effective way to assess market sentiment is by using momentum statistics. By keeping these factors in mind, traders can better understand the significance of divergences on trading charts.
While these statistics may work for certain traders, it is important to acknowledge the importance of other factors and metrics as well. Also, endeavor to apply basic risk management tips, as ignoring this could lead to grave losses in cases where the trades don’t go as expected.
Having said this, always do your own research before trading any asset, and also note that this article is only for educational purposes and is not meant as financial advice.


Joel is deeply interested in the technologies behind cryptocurrencies and blockchain networks. In his over 7 years of involvement in the space, he helps startups build a stronger internet presence through written content. Follow the author on Twitter @agboifesinachi


 Or check it out in the app stores