
What is OHLCV & Its Significance in Crypto Trading
OHLCV stands for Open, High, Low, Close, and Volume, and represents the trading activity of a financial asset over a specific time period. The key components of OHLCV data are:
- Open: The price at the beginning of the time period.
- High: The highest price reached during the time period.
- Low: The lowest price reached during the time period.
- Close: The price at the end of the time period.
- Volume: The total volume traded during the time period.
OHLCV data is commonly used to create candlestick charts, translates the data visually, allowing traders and analysts to assess market trends, price movements, and trading volumes. Here's an example of an OHLCV chart:
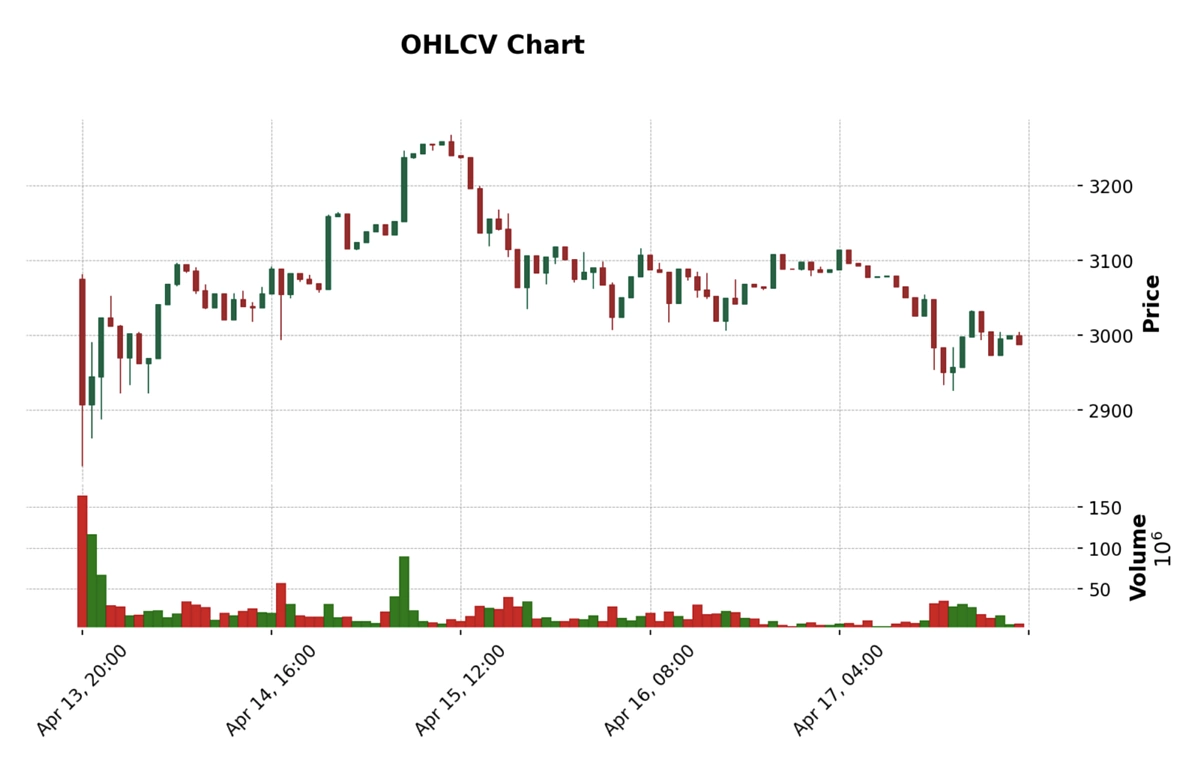
Moreover, OHLCV charts provide valuable insights into the trading activity within liquidity pools, which are crucial components of decentralized exchanges (DEXs) and automated market makers (AMMs). By analyzing OHLCV data, liquidity providers can gauge market sentiment, volatility, and the overall health of the pool. This information is essential for making informed decisions about providing liquidity, setting pool parameters, and managing risk.
Visualizing OHLCV data through charts empowers users to modify and interact with the data dynamically, enhancing decision-making capabilities and allowing for a more comprehensive understanding of the market dynamics within liquidity pools. By examining historical price and volume patterns, liquidity providers can identify trends, determine optimal entry and exit points, and adjust their liquidity provision accordingly.
In this tutorial, we’ll be building an interactive OHLCV candlestick chart that chains multiple API calls together, to enable a superior user experience. Let's dive in!
Prerequisites
Ensure you have the following set up:
- Pandas: Used for processing and working with tabular data
- Matplotlib: A library for data visualization
- mplfinance: A subset of Matplotlib specifically for financial data
As we'll also be making calls to CoinGecko API's paid /onchain endpoint, ensure you are subscribed and have generated your API key.
Step 1: How to Get Historical OHLCV Data with CoinGecko API
The core of our application involves getting OHLCV data over a given time interval (read more about the endpoint on CoinGecko API's documentation). Let’s start by defining a function that wraps our desired functionality and input parameters.
@st.cache_data
def fetch_ohlcv_data(network_id, pool_id, interval="hour"):
url = f"https://pro-api.coingecko.com/api/v3/onchain/networks/{network_id}/pools/{pool_id}/ohlcv/{interval}"
response = requests.get(url, headers=HEADERS)
if response.status_code == 200:
return response.json()
else:
st.error(f"Failed to retrieve OHLCV data. Status code: {response.status_code}")
return []
The JSON payload returned from above can be parsed and massaged into a pandas dataframe for easier processing. Let’s define a new function that does just this for use downstream in our graph components:
def parse_ohlcv_data(json_payload):
# Extract OHLCV list and metadata from the payload
ohlcv_list = json_payload["data"]["attributes"]["ohlcv_list"]
metadata = json_payload["meta"]
# Parse OHLCV data into a DataFrame
columns = ["timestamp", "open", "high", "low", "close", "volume"]
df = pd.DataFrame(ohlcv_list, columns=columns)
df["timestamp"] = pd.to_datetime(df["timestamp"], unit="s")
# Return both the DataFrame and metadata
return df, metadata
Step 2: Creating the OHLCV Chart with mplfinance Library
Now that we have our data in Pandas, we can move on with visualizing it in an OHLCV chart. We’ll use mplfinance, a financial data visualization library to show this data. At the time of writing, you’ll need to use st.pylot to wrap matplotlib figures as discussed in this thread. Our root function will take the dataframe we extracted earlier and fill it with the sorted data (note, this is an important step).
def plot_ohlcv(df):
# Ensure the DataFrame is sorted by timestamp in ascending order
df_sorted = df.sort_values("timestamp").set_index("timestamp")
mpf.plot(
df_sorted,
type="candle",
style="charles",
title="OHLCV Chart",
ylabel="Price",
ylabel_lower="Volume",
volume=True,
figratio=(16, 8),
show_nontrading=False,
)
Because we labeled our columns with the correct names in the last step, we don’t need to do anything fancy here, other than set up chart attributes to customise its appearance.
Step 3: Chained API Calls to Fetch Network & Trading Pairs Data
Now that we have our core data and plotting functionalities finished, let’s revisit the fetch_ohlcv_data function we created previously. Our function inputs are defined by a network_id, pool_id, and an interval. Because the network and pool ids are both long strings that are unique and specific to a particular network and pool respectively, we would like to abstract the process of selecting and inserting these ids by instead using the names of the respective attributes.
We can achieve this for the user by creating dropdowns that are populated by calls to the associated endpoints. Let’s start by loading all networks with this function:
@st.cache_data
def fetch_networks_data():
url = "https://pro-api.coingecko.com/api/v3/onchain/networks?page=1"
response = requests.get(url, headers=HEADERS)
if response.status_code == 200:
networks = response.json()["data"]
return {network["attributes"]["name"]: network["id"] for network in networks}
else:
st.error(
f"Failed to retrieve networks data. Status code: {response.status_code}"
)
return {}
We can now expose those values to the user with a selectbox, where we only display the names of the networks and keep the associated ids abstracted in the background.
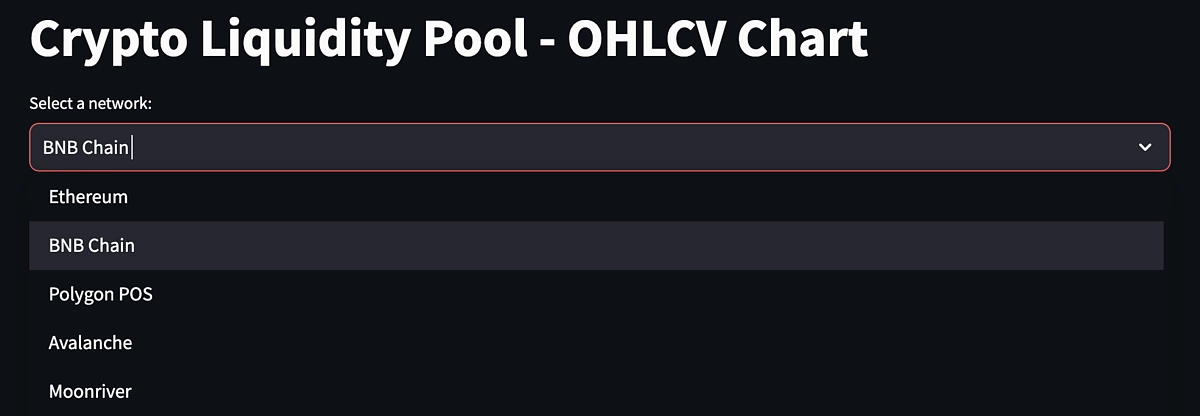
# Fetch networks data and populate the dropdown
networks_data = fetch_networks_data()
selected_network = st.selectbox("Select a network:", list(networks_data.keys()))
Now that we have selected our network, we can set the id for the page:
# Use the selected network's ID for downstream tasks
network_id = networks_data[selected_network]
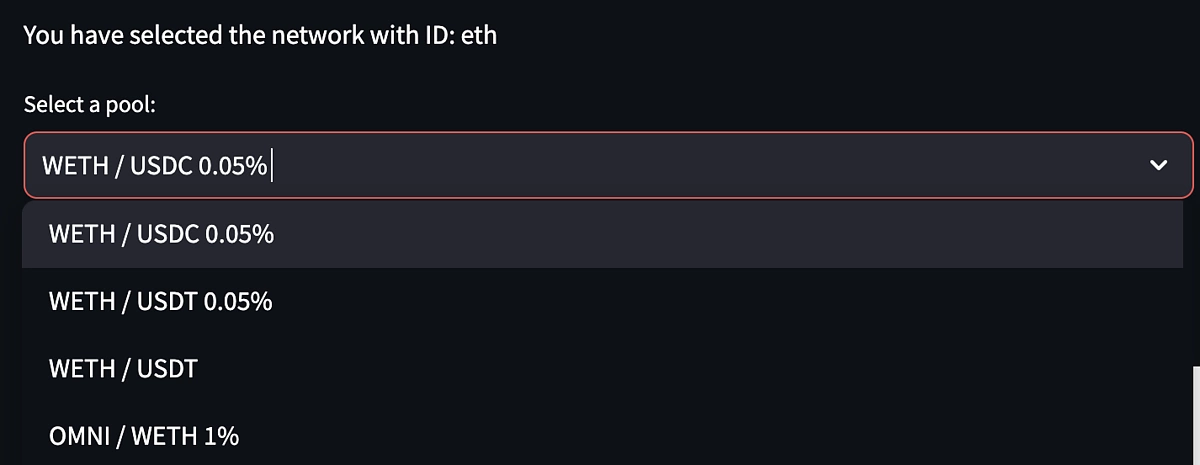
st.write(f"You have selected the network with ID: {network_id}")
Repeat the above process for the pools, inserting our network_id dynamically into our API call to populate the pools dropdown as shown below:
# Fetch pools data for the selected network
pools_data = fetch_data(f"/networks/{network_id}/pools?page=1")
if pools_data:
print(pools_data)
# Extract pool names and IDs, and use only the part after the underscore for the ID
try:
pool_options = {
pool["attributes"]["name"]: pool["id"].split("_")[-1]
for pool in pools_data["data"]
}
except:
pool_options = {
pool["attributes"]["name"]: pool["id"].split("_")[0]
for pool in pools_data["data"]
}
print(pool_options)
# Create two columns for the pool and interval dropdowns
col_pool, col_interval = st.columns([3, 1])
with col_pool:
# Create a dropdown for pool names
selected_pool_name = st.selectbox(
"Select a pool:", list(pool_options.keys())
)
with col_interval:
# Create a dropdown for OHLCV interval selection
ohlcv_interval = st.selectbox(
"Select interval:", ["day", "hour", "minute"], index=1
)
# Get the selected pool ID using the selected pool name
selected_pool_id = pool_options[selected_pool_name]
Note that we used a slightly different API calling function, where fetch_data only takes the associated endpoint with the base URL being preset. The dropdown for interval has also been hard coded based on the 3 available interval values.
Now with our ids and intervals, we are ready to put it all together: fetch the associated pool data and render it using mplfinance/matplotlib:
# Fetch and parse the OHLCV data using the selected pool ID and interval
ohlcv_response = fetch_ohlcv_data(network_id, selected_pool_id, ohlcv_interval)
if ohlcv_response:
df_ohlcv, metadata = parse_ohlcv_data(ohlcv_response)
# Use metadata as needed, for example:
st.write("Base Token:", metadata["base"]["name"])
st.write("Quote Token:", metadata["quote"]["name"])
st.pyplot(plot_ohlcv(df_ohlcv))
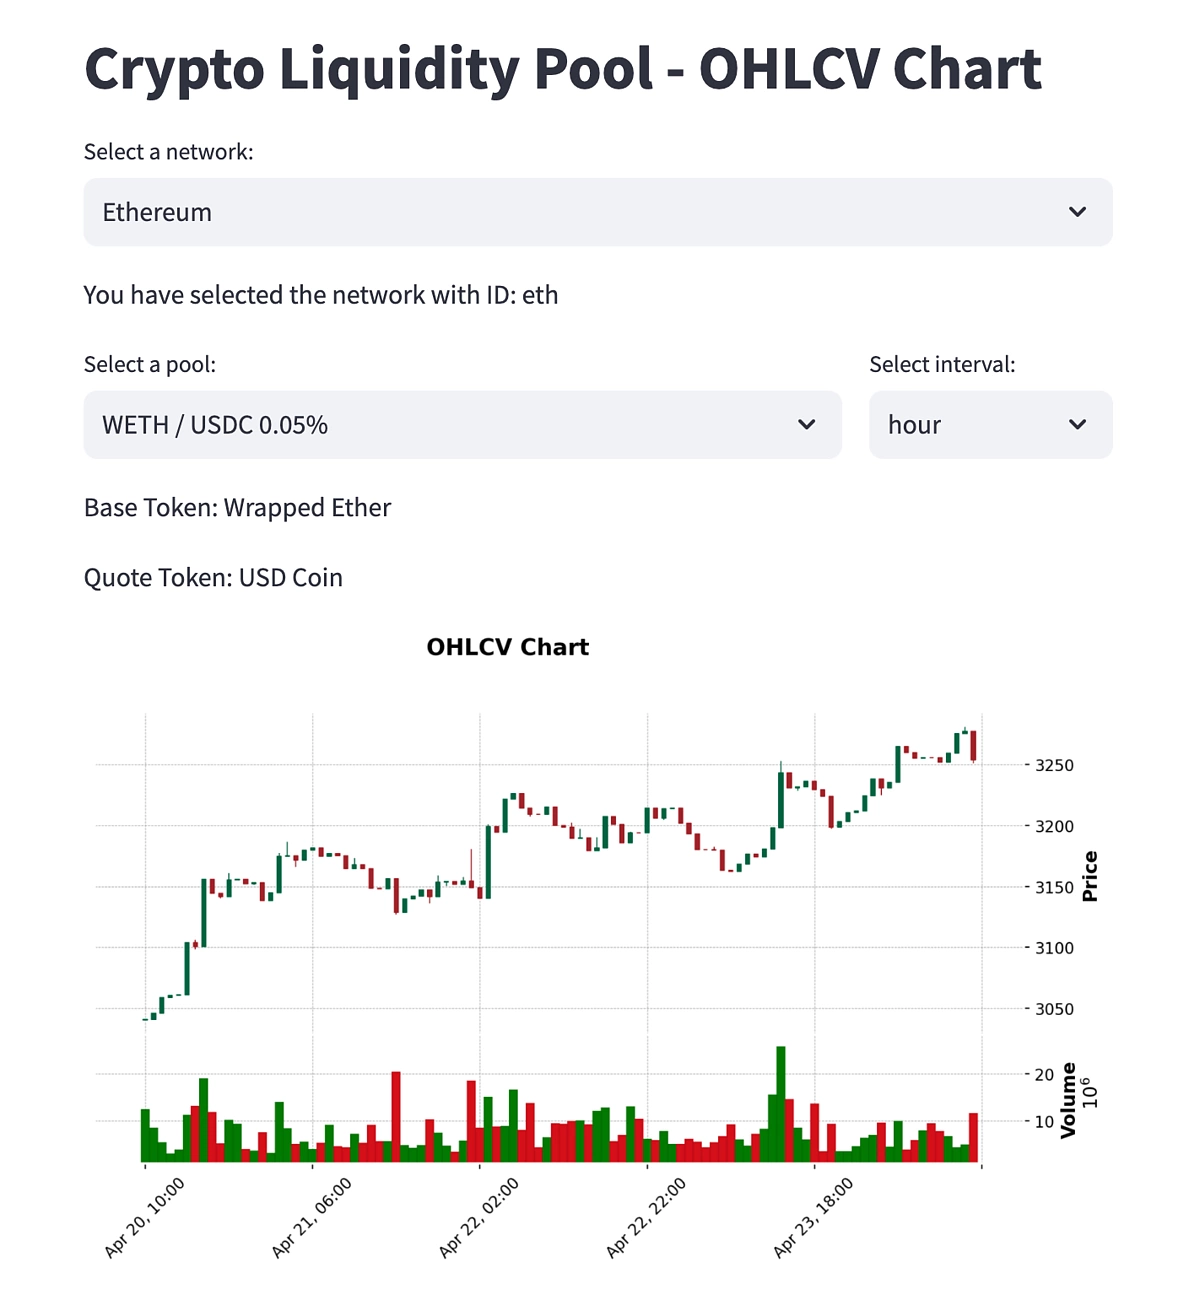
The Final Product: Interactive OHLCV Candlestick Chart
This is how the final candlestick chart appears on Streamlit:
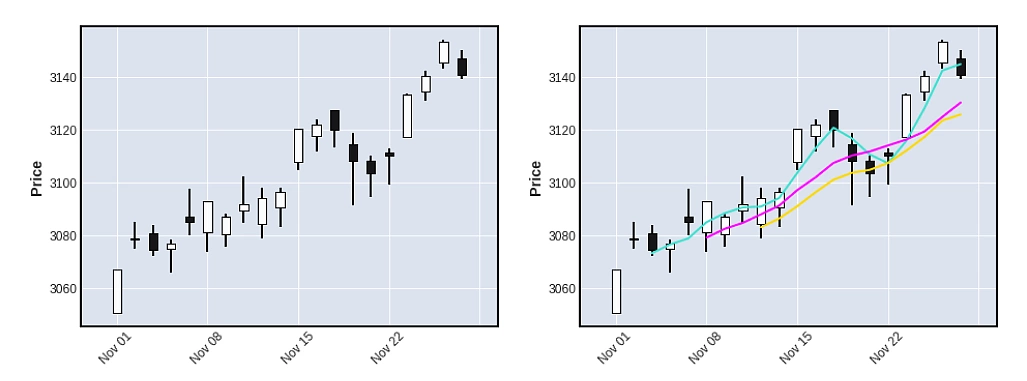
Customization Options & Enhancements
If you’d like to add on other features to your chart like overlays, technical indicators, or just switch up the colors and styles, refer to their documentation on how to adjust it to your liking. Try changing type=’renko’ and see for yourself!
Conclusion
In this tutorial, we explored the significance of OHLCV charts in the context of cryptocurrency trading and liquidity pools. We learned how to fetch historical OHLCV data using the CoinGecko API and parse it into a Pandas DataFrame for further processing. By leveraging the mplfinance library, we created interactive and visually appealing OHLCV charts that provide valuable insights into price movements and trading volumes.
Furthermore, we demonstrated how to chain multiple API calls together to enhance the user experience. By fetching network and trading pair data dynamically, we enabled users to select their desired network and pool from dropdown menus, making the chart more interactive and user-friendly.
We encourage readers to explore the mplfinance documentation further and experiment with different chart styles, colors, and additional features to create even more powerful and insightful OHLCV charts.
Finally, if you’d like a copy of this implementation, check out this repo.


 Or check it out in the app stores

