





Porteføljer
Legg til ny portefølje

Største DragonFly Capital Portfolio mynter etter markedsverdi
Den globale markedsverdien til DragonFly Capital Portfolio er i dag USD0, en endring på 0.0% de siste 24 timene.
Høydepunkter
$0.00
Markedsverdi
0.0%

$0.00
24-timers omsetning

| # | Mynt | Kurs | 1t | 24t | 7d | 30d | 24t omsetning | Markedsverdi | FVM | Markedsverdi/FVM | Siste 7 dager | ||
|---|---|---|---|---|---|---|---|---|---|---|---|---|---|
| 19 |

NEAR Protocol
NEAR
|
Kjøp
|
$4.95 | 0.4% | 6.6% | 0.2% | 13.1% | $742,852,714 | $6,474,625,400 | $6,474,625,662 | 0.9999999595308829 |
|
|
| 28 |

Avalanche
AVAX
|
Kjøp
|
$9.17 | 0.1% | 6.7% | 7.2% | 17.0% | $304,107,910 | $4,069,086,509 | $4,313,402,152 | 0.9433589462818066 |
|
|
| 41 |

Ethena
ENA
|
Kjøp
|
$0.1985 | 0.0% | 5.5% | 2.4% | 4.7% | $600,341,555 | $2,657,798,287 | $2,973,760,321 | 0.89375 |
|
|
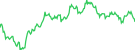
| 56 |

Mantle
MNT
|
Kjøp
|
$0.5353 | 0.0% | 2.6% | 2.6% | 18.4% | $27,790,724 | $1,767,585,268 | $3,329,243,332 | 0.5309270280700088 |
|
|
| 66 |

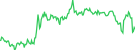
Bitget Token
BGB
|
Kjøp
|
$1.89 | 0.0% | 2.0% | 1.5% | 10.1% | $8,378,612 | $1,323,444,977 | $1,716,482,255 | 0.7710216482933642 |
|
|
| 80 |

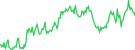
Cosmos Hub
ATOM
|
Kjøp
|
$1.71 | 0.9% | 3.5% | 0.5% | 2.7% | $52,186,538 | $921,223,271 | $921,223,271 | 1.0 |
|
|
| 93 |

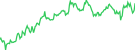
Aptos
APT
|
Kjøp
|
$0.7714 | 0.7% | 7.5% | 4.4% | 1.3% | $58,882,602 | $681,184,561 | $933,448,671 | 0.7297504211583229 |
|
|
| 139 |

Lido DAO
LDO
|
Kjøp
|
$0.3825 | 0.0% | 8.0% | 3.3% | 6.2% | $47,561,751 | $317,241,979 | $382,418,403 | 0.8295677642043007 |
|
|
| 237 |

1INCH
1INCH
|
Kjøp
|
$0.09127 | 0.1% | 4.3% | 1.8% | 10.3% | $21,156,278 | $128,230,198 | $136,844,664 | 0.9370493104868763 |
|
|
| 286 |

dYdX
DYDX
|
$0.1149 | 0.3% | 5.9% | 5.6% | 14.6% | $2,204,002 | $97,161,947 | $110,052,103 | 0.882872245395192 |
|
||
| 328 |

Numeraire
NMR
|
$10.60 | 0.1% | 7.1% | 9.7% | 12.2% | $10,264,175 | $75,979,665 | $112,355,626 | 0.6762426370308473 |
|
||
| 334 |

Nervos Network
CKB
|
$0.001510 | 0.3% | 4.1% | 0.3% | 15.7% | $4,621,225 | $75,128,202 | $76,423,862 | 0.9830463934295715 |
|
||
| 367 |

GAL (migrated to Gravity - G)
GAL
|
$0.5148 | 0.0% | 2.0% | 0.7% | 19.7% | $14.63 | $65,761,305 | $102,953,659 | 0.6387466559367218 |
|
||
| 495 |

Siacoin
SC
|
$0.0008950 | 0.1% | 0.1% | 7.6% | 6.3% | $4,409,162 | $44,540,850 | $44,540,850 | 1.0 |
|
||
| 522 |

Aurora
AURORA
|
$0.05572 | 0.7% | 6.8% | 11.7% | 56.5% | $600,050 | $41,535,015 | $55,693,222 | 0.7457822318381003 |
|
||
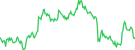
| 578 |

APEX
APEX
|
$0.2246 | 0.1% | 7.3% | 0.6% | 11.0% | $1,467,666 | $35,464,963 | $112,292,717 | 0.31582603031652057 |
|
||
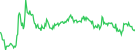
| 809 |

Aevo
AEVO
|
$0.02242 | 0.0% | 3.0% | 4.7% | 9.6% | $2,840,564 | $20,904,170 | $22,412,491 | 0.9327018060000001 |
|
||
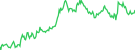
| 847 |

WOO
WOO
|
$0.01029 | 0.4% | 6.3% | 9.6% | 17.4% | $1,546,382 | $19,428,836 | $19,428,836 | 1.0 |
|
||
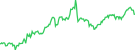
| 933 |

BENQI
QI
|
$0.002301 | 0.2% | 5.4% | 12.9% | 59.4% | $946,897 | $16,543,945 | $16,543,945 | 1.0 |
|
||
| 975 |

SynFutures
F
|
$0.002965 | 0.4% | 6.0% | 0.5% | 17.8% | $1,271,452 | $15,025,333 | $29,604,498 | 0.5075354617 |
|
||
| 1080 |

Orderly
ORDER
|
$0.03078 | 0.6% | 5.5% | 5.5% | 21.6% | $2,690,711 | $12,680,724 | $30,788,293 | 0.4118683618254271 |
|
||
| 1278 |

Save
SAVE
|
$0.1787 | 0.0% | 0.8% | 1.4% | 10.6% | $197.29 | $8,934,453 | $8,934,453 | 1.0 |
|
||
| 1312 |

Ref Finance
REF
|
$0.08851 | 1.5% | 7.3% | 7.6% | 1.9% | $274.22 | $8,496,593 | $8,851,062 | 0.9599518199999999 |
|
||
| 1340 |

saffron.finance
SFI
|
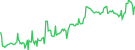
$101.79 | 0.0% | 1.0% | 2.6% | 16.6% | $57,427.59 | $8,156,606 | $10,178,849 | 0.8013289071013564 |
|
||
| 1554 |

MyShell
SHELL
|
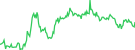
$0.02158 | 0.3% | 5.6% | 0.7% | 18.7% | $2,644,443 | $5,825,808 | $21,577,066 | 0.27 |
|
||
| 1586 |

Parcl
PRCL
|
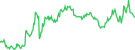
$0.005981 | 0.0% | 3.2% | 3.9% | 3.6% | $94,732.14 | $5,452,291 | $5,981,073 | 0.911590805778956 |
|
||
| 1631 |

Hashflow
HFT
|
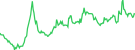
$0.005476 | 0.6% | 5.2% | 12.3% | 10.9% | $1,201,319 | $5,143,825 | $5,475,557 | 0.9394157889489 |
|
||
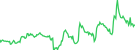
| 1662 |

Secret
SCRT
|
$0.007124 | 0.1% | 1.4% | 1.1% | 15.8% | $54,608.54 | $4,887,836 | $10,351,703 | 0.4721770439536943 |
|
||

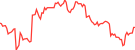
Ribbon Finance
RBN
|
$0.02251 | 0.0% | 1.5% | 9.4% | 8.8% | $1.11 | $1,515,103 | $22,513,274 | 0.06729819299999999 |
|
|||
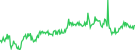
| 2697 |

ThunderCore
TT
|
$0.00008979 | 0.6% | 1.2% | 3.9% | 3.8% | $24,172.76 | $1,316,615 | $1,316,615 | 1.0 |
|
||
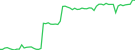
| 2956 |

SIPHER
SIPHER
|
$0.002439 | 0.1% | 4.9% | 28.4% | 51.6% | $103.39 | $997,782 | $1,000,785 | 0.9969991732827407 |
|
||
| 3089 |

Shrapnel
SHRAP
|
$0.0002981 | 0.0% | 46.4% | 25.6% | 23.2% | $241.15 | $865,563 | $894,163 | 0.9680139638637122 |
|
||
| 3273 |

RSS3
RSS3
|
$0.0007205 | 0.4% | 3.6% | 23.6% | 73.9% | $29,636.32 | $720,449 | $720,449 | 1.0 |
|
||
| 4068 |

Gelato
GEL
|
$0.001194 | 0.1% | 16.7% | 29.1% | 65.4% | $236.74 | $342,325 | $502,101 | 0.6817850358724424 |
|
||
| 5053 |

Aurigami
PLY
|
$0.00004049 | 0.7% | 6.3% | 0.8% | 6.5% | $49.22 | $167,098 | $404,914 | 0.41267631349999995 |
|
||
| 5247 |

PoolTogether
POOL
|
$0.01512 | 0.1% | 8.2% | 12.9% | 35.8% | $438.68 | $145,380 | $151,211 | 0.9614359528541 |
|
||
| 5399 |

Trisolaris
TRI
|
$0.0003408 | 0.9% | 4.6% | 155.3% | 173.1% | $1,430.58 | $129,021 | $200,173 | 0.6445474652587166 |
|
||

Everyworld
EVERY
|
$0.00003002 | 0.0% | 5.5% | 5.5% | 1.2% | $114.64 | $124,588 | $300,159 | 0.41507227933210994 |
|
|||

Solend
SLND
|
$0.1787 | 0.0% | 2.9% | 10.4% | 9.6% | $48.08 | - | $17,873,793 |
|
||||

BitDAO
BIT
|
$0.5681 | 0.0% | 7.8% | 14.2% | 11.2% | $442.87 | - | $64,675,551 |
|
||||

Opyn Squeeth
OSQTH
|
$77.82 | 0.0% | 2.4% | 1.2% | 12.4% | $0.9865 | - | $421,631 |

|
||||

MATIC (migrated to POL)
MATIC
|
$0.1262 | - | - | - | - | $0.1468 | - | $1,261,558,705 |

|
||||

Maker
MKR
|
$1,702.90 | 1.1% | 2.4% | 7.2% | 10.2% | $110,442 | - | $141,163,541 |
|
||||

Polymarket
POLY
|
$0.00 | - | - | - | - | - | - | - |

|
||||
Viser 1 til 44 av 44 resultater
Rader
Markedsverdi-graf DragonFly Capital Portfolio over ledende mynter
Grafen nedenfor viser markedsverdien og dominansen til store. DragonFly Capital Portfolio inkludert NEAR Protocol, Avalanche, Ethena og andre, over en tidsperiode.
Prestasjonsgraf DragonFly Capital Portfolio over ledende mynter
Grafen nedenfor viser den relative ytelsen til ledende DragonFly Capital Portfolio mynter over tid, og sporer prosentvise prisgevinster og tap i forskjellige tidsperioder.




 Eller sjekk ut i App Store


