





Portfolios
Zu neuem Portfolio hinzufügen

Top-Bittensor Subnets-Währungen nach Marktkapitalisierung
Die Marktkapitalisierung von Bittensor Subnets beträgt heute 1,16 Milliarde $, eine Veränderung von -2.8% in den letzten 24 Stunden.
Höhepunkte
$1.157.354.264
Marktkap
2.8%

$33.060.775
24-Stunden-Handelsvolumen

🔥 Trends
Derzeit sind keine Kryptowährungen im Trend verfügbar.
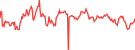
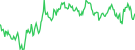
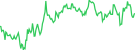
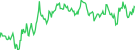
| # | Kryptowährung | Kurs | 1h | 24h | 7d | 30d | 24-Stunden-Volumen | Marktkapitalisierung | FDV | Marktkapitalisierung /FDV | Letzte 7 Tage | ||
|---|---|---|---|---|---|---|---|---|---|---|---|---|---|
| 204 |

lium
SN51
|
$31,67 | 0.1% | 3.0% | 9.5% | 10.0% | $4.902.472 | $158.910.093 | $158.910.093 | 1.0 |
|
||
| 269 |

Chutes
SN64
|
$17,02 | 0.0% | 0.3% | 2.6% | 21.2% | $459.243 | $106.838.120 | $106.838.120 | 1.0 |
|
||
| 311 |

Targon
SN4
|
$14,45 | 0.7% | 1.6% | 6.0% | 11.3% | $2.306.668 | $84.633.084 | $84.633.084 | 1.0 |
|
||
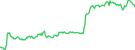
| 467 |

EfficientFrontier
SN53
|
$8,42 | 0.5% | 2.9% | 3.2% | 16.5% | $1.701.174 | $48.890.471 | $48.890.471 | 1.0 |
|
||
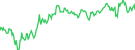
| 487 |

affine
SN120
|
$10,50 | 0.1% | 0.2% | 1.1% | 23.8% | $152.801 | $46.299.148 | $46.299.148 | 1.0 |
|
||
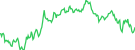
| 492 |

Score
SN44
|
$7,85 | 0.4% | 7.2% | 10.9% | 23.0% | $1.355.403 | $45.570.885 | $45.570.885 | 1.0 |
|
||
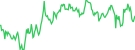
| 498 |

Vanta Network
VANTA
|
$8,07 | 0.2% | 4.3% | 0.3% | 8.2% | $1.400.268 | $44.987.733 | $44.987.733 | 1.0 |
|
||
| 629 |

τemplar
SN3
|
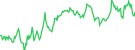
$5,73 | 0.3% | 1.7% | 1.8% | 34.8% | $305.128 | $33.338.080 | $33.338.080 | 1.0 |
|
||
| 660 |

iota
SN9
|
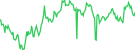
$5,90 | 0.1% | 1.1% | 3.1% | 23.6% | $77.029,04 | $30.770.852 | $30.770.852 | 1.0 |
|
||
| 786 |

Hippius
SN75
|
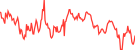
$4,55 | 0.0% | 0.6% | 3.0% | 11.3% | $540.163 | $23.367.141 | $23.367.141 | 1.0 |
|
||
| 798 |

NOVA
SN68
|
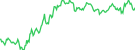
$4,17 | 0.0% | 0.0% | 3.4% | 34.6% | $309.343 | $22.645.615 | $22.645.615 | 1.0 |
|
||
| 859 |

Gradients
SN56
|
$3,66 | 0.1% | 0.3% | 4.8% | 21.5% | $23.542,11 | $20.198.569 | $20.198.569 | 1.0 |
|
||
| 861 |

Green Compute
SN110
|
$6,25 | 0.7% | 4.4% | 2.3% | 22.1% | $979.505 | $20.116.331 | $20.116.331 | 1.0 |
|
||
| 897 |

BitMind
SN34
|
$3,39 | 0.1% | 1.7% | 8.5% | 5.9% | $300.865 | $19.101.032 | $19.101.032 | 1.0 |
|
||
| 986 |

Bitcast
SN93
|
$3,65 | 0.1% | 2.8% | 25.4% | 35.2% | $234.010 | $15.933.083 | $15.933.083 | 1.0 |
|
||
| 990 |

basilica
SN39
|
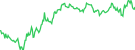
$3,35 | 1.1% | 0.9% | 32.2% | 56.2% | $737.519 | $15.680.132 | $15.680.132 | 1.0 |
|
||
| 1038 |

OMEGA Labs
SN24
|
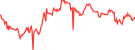
$2,64 | 0.6% | 1.8% | 33.3% | 85.3% | $779.154 | $14.314.636 | $14.314.636 | 1.0 |
|
||
| 1054 |

OpenKaito
SN5
|
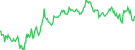
$3,05 | 0.0% | 0.6% | 5.4% | 22.0% | $32.999,24 | $14.058.115 | $14.058.115 | 1.0 |
|
||
| 1070 |

Tiger Alpha
SN107
|
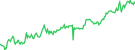
$6,73 | 2.9% | 14.6% | 16.6% | 50.1% | $834.676 | $13.767.056 | $13.767.056 | 1.0 |
|
||
| 1158 |

Blockmachine
SN19
|
$2,28 | 0.0% | 1.5% | 2.4% | 18.4% | $167.101 | $12.105.785 | $12.105.785 | 1.0 |
|
||
| 1166 |

RedTeam
SN61
|
$2,12 | 0.3% | 3.9% | 30.7% | 37.7% | $429.990 | $11.913.610 | $11.913.610 | 1.0 |
|
||
| 1171 |

Ridges AI
SN62
|
$2,11 | 0.2% | 0.4% | 4.1% | 34.0% | $73.636,83 | $11.885.129 | $11.885.129 | 1.0 |
|
||
| 1176 |

Cacheon
SN14
|
$2,35 | 0.2% | 0.6% | 6.0% | 12.6% | $242.486 | $11.795.357 | $11.795.357 | 1.0 |
|
||
| 1182 |

OpenRoboto
SN80
|
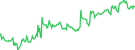
$4,50 | 12.4% | 12.0% | 23.8% | 44.6% | $601.595 | $11.654.653 | $11.654.653 | 1.0 |
|
||
| 1212 |

Sportstensor
SN41
|
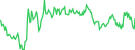
$2,20 | 1.9% | 4.7% | 11.0% | 4.3% | $692.200 | $11.072.433 | $11.072.433 | 1.0 |
|
||
| 1224 |

Quantum Compute
SN48
|
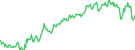
$1,97 | 0.9% | 2.8% | 51.1% | 59.9% | $504.819 | $10.788.022 | $10.788.022 | 1.0 |
|
||
| 1231 |

404—GEN
SN17
|
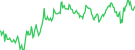
$1,78 | 0.1% | 0.1% | 6.8% | 34.0% | $73.278,66 | $10.701.373 | $10.701.373 | 1.0 |
|
||
| 1274 |

Level 114
SN114
|
$4,60 | 1.4% | 9.4% | 16.9% | 15.9% | $377.509 | $10.021.844 | $10.021.844 | 1.0 |
|
||
| 1285 |

ORO
SN15
|
$4,80 | 0.7% | 6.9% | 7.8% | 33.1% | $271.159 | $9.916.599 | $9.916.599 | 1.0 |
|
||
| 1295 |

Swarm
SN124
|
$2,30 | 0.0% | 0.6% | 4.2% | 22.4% | $255.040 | $9.677.003 | $9.677.003 | 1.0 |
|
||
| 1312 |

Dippy
SN11
|
$1,87 | 0.2% | 0.3% | 8.9% | 20.7% | $116.065 | $9.504.874 | $9.504.874 | 1.0 |
|
||
| 1403 |

Apex
SN1
|
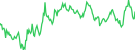
$1,56 | 0.0% | 0.3% | 5.3% | 22.7% | $69.780,63 | $8.203.902 | $8.203.902 | 1.0 |
|
||
| 1416 |

Nuance
SN23
|
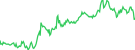
$1,58 | 1.8% | 9.6% | 10.6% | 3.0% | $458.179 | $7.972.676 | $7.972.676 | 1.0 |
|
||
| 1451 |

Quantum Innovate
SN63
|
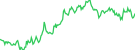
$1,36 | 0.2% | 1.1% | 40.6% | 10.0% | $313.089 | $7.584.255 | $7.584.255 | 1.0 |
|
||
| 1458 |

Dojo
SN52
|
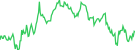
$1,52 | 0.0% | 0.1% | 2.1% | 18.0% | $117.854 | $7.545.672 | $7.545.672 | 1.0 |
|
||
| 1525 |

UR
SN25
|
$1,30 | 0.3% | 0.2% | 7.7% | 36.9% | $147.705 | $6.858.944 | $6.858.944 | 1.0 |
|
||
| 1530 |

Liquidity
SN77
|
$1,18 | 0.0% | 0.2% | 5.5% | 24.0% | $3.340,71 | $6.771.712 | $6.771.712 | 1.0 |
|
||
| 1565 |

FlameWire
SN97
|
$3,15 | 1.4% | 2.1% | 8.1% | 37.2% | $200.043 | $6.435.134 | $6.435.134 | 1.0 |
|
||
| 1578 |

SN21 AdTAO
SN21
|
$1,14 | 1.0% | 4.1% | 6.2% | 14.0% | $679.884 | $6.215.301 | $6.215.301 | 1.0 |
|
||
| 1590 |

WebGenieAI
SN54
|
$1,10 | 0.0% | 5.4% | 11.4% | 35.7% | $217.314 | $6.120.580 | $6.120.580 | 1.0 |
|
||
| 1593 |

Pareton
SN10
|
$1,14 | 0.0% | 0.4% | 7.2% | 41.4% | $117.110 | $6.108.236 | $6.108.236 | 1.0 |
|
||
| 1607 |

THOR
SN112
|
$2,15 | 0.3% | 8.0% | 7.6% | 28.8% | $481.718 | $5.955.269 | $5.955.269 | 1.0 |
|
||
| 1609 |

grail
SN81
|
$1,24 | 0.8% | 0.9% | 5.0% | 24.8% | $151.881 | $5.946.618 | $5.946.618 | 1.0 |
|
||
| 1612 |

Vidaio
SN85
|
$1,18 | 0.5% | 1.5% | 11.5% | 29.3% | $227.848 | $5.920.362 | $5.920.362 | 1.0 |
|
||
| 1621 |

Data Universe
SN13
|
$1,04 | 0.0% | 0.7% | 2.2% | 28.0% | $771.327 | $5.814.257 | $5.814.257 | 1.0 |
|
||
| 1628 |

Compute Horde
SN12
|
$1,20 | 0.0% | 0.3% | 2.4% | 16.6% | $49.817,50 | $5.719.670 | $5.719.670 | 1.0 |
|
||
| 1665 |

Graphite
SN43
|
$1,02 | 0.0% | 3.0% | 1.0% | 16.8% | $64.411,86 | $5.396.019 | $5.396.019 | 1.0 |
|
||
| 1677 |

Zeus
SN18
|
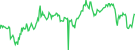
$0,9311 | 0.0% | 0.8% | 2.8% | 16.1% | $104.899 | $5.326.015 | $5.326.015 | 1.0 |
|
||
| 1705 |

Synth
SN50
|
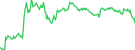
$0,9104 | 1.4% | 1.9% | 3.8% | 26.7% | $167.280 | $5.092.347 | $5.092.347 | 1.0 |
|
||
| 1761 |

Leadpoet
SN71
|
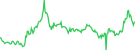
$0,9572 | 0.1% | 2.4% | 5.7% | 18.8% | $291.196 | $4.743.102 | $4.743.102 | 1.0 |
|
||
| 1786 |

Omron
SN2
|
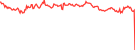
$0,8914 | 1.0% | 8.4% | 3.4% | 6.4% | $278.312 | $4.623.935 | $4.623.935 | 1.0 |
|
||
| 1816 |

Oneoneone
SN111
|
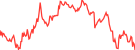
$1,00 | 0.0% | 0.1% | 4.3% | 25.5% | $47.025,78 | $4.377.227 | $4.377.227 | 1.0 |
|
||
| 1821 |

Bettensor
SN30
|
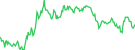
$0,8156 | 0.0% | 0.1% | 2.8% | 17.6% | $1.504,16 | $4.331.808 | $4.331.808 | 1.0 |
|
||
| 1885 |

ItsAI
SN32
|
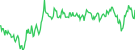
$0,6290 | 0.0% | 0.2% | 4.4% | 25.1% | $24.878,64 | $3.956.981 | $3.956.981 | 1.0 |
|
||
| 1899 |

ReadyAI
SN33
|
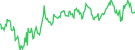
$0,7651 | 0.0% | 0.9% | 4.8% | 36.8% | $20.188,93 | $3.869.478 | $3.869.478 | 1.0 |
|
||
| 1901 |

τaos
SN79
|
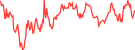
$0,7784 | 0.0% | 1.1% | 1.4% | 15.2% | $72.287,22 | $3.859.236 | $3.859.236 | 1.0 |
|
||
| 1912 |

Bitsec.ai
SN60
|
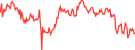
$0,7209 | 0.0% | 0.6% | 18.9% | 43.5% | $338.197 | $3.784.644 | $3.784.644 | 1.0 |
|
||
| 1930 |

Desearch
SN22
|
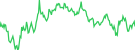
$0,7285 | 0.2% | 0.3% | 3.2% | 18.8% | $82.965,49 | $3.677.027 | $3.677.027 | 1.0 |
|
||
| 1950 |

Coldint
SN29
|
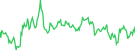
$0,6320 | 0.0% | 0.2% | 4.1% | 25.9% | $945,36 | $3.590.001 | $3.590.001 | 1.0 |
|
||
| 1958 |

Ditto
SN118
|
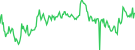
$1,19 | 1.5% | 21.0% | 11.1% | 46.2% | $400.951 | $3.535.874 | $3.535.874 | 1.0 |
|
||
| 1970 |

Instant Inference
SN46
|
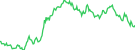
$0,6906 | 0.2% | 1.2% | 15.2% | 34.9% | $101.222 | $3.468.204 | $3.468.204 | 1.0 |
|
||
| 1978 |

Precog
SN55
|
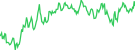
$0,6271 | 0.0% | 0.8% | 5.9% | 18.1% | $201.573 | $3.428.660 | $3.428.660 | 1.0 |
|
||
| 1979 |

InfiniteHash
SN89
|
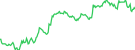
$0,7479 | 0.1% | 0.1% | 1.9% | 19.6% | $5.478,85 | $3.421.827 | $3.421.827 | 1.0 |
|
||
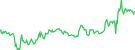
| 2008 |

Distributed Training
SN38
|
$1,55 | 4.2% | 25.9% | 67.7% | 76.2% | $621.556 | $3.330.575 | $3.330.575 | 1.0 |
|
||
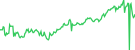
| 2013 |

PolarisCloud.ai
SN49
|
$1,38 | 0.5% | 5.6% | 17.6% | 48.4% | $128.439 | $3.316.278 | $3.316.278 | 1.0 |
|
||
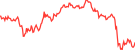
| 2024 |

Aurelius
SN37
|
$0,6587 | 0.0% | 0.3% | 6.8% | 20.5% | $37.849,57 | $3.249.440 | $3.249.440 | 1.0 |
|
||
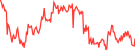
| 2031 |

FakeNews
SN66
|
$0,6172 | 0.0% | 2.7% | 3.5% | 40.5% | $98.363,53 | $3.225.648 | $3.225.648 | 1.0 |
|
||
| 2033 |

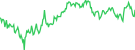
Sταking
SN88
|
$0,5968 | 0.9% | 7.4% | 11.5% | 33.3% | $152.575 | $3.215.835 | $3.215.835 | 1.0 |
|
||
| 2046 |

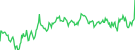
SubVortex
SN7
|
$0,5768 | 0.0% | 1.4% | 2.1% | 22.4% | $52.232,05 | $3.158.161 | $3.158.161 | 1.0 |
|
||
| 2078 |

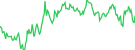
Merit
SN73
|
$0,7133 | 0.0% | 0.0% | 9.2% | 27.6% | $7.439,85 | $3.061.753 | $3.061.753 | 1.0 |
|
||
| 2125 |

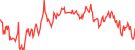
NI Compute
SN27
|
$0,5815 | 0.0% | 0.6% | 2.0% | 12.6% | $148.749 | $2.865.279 | $2.865.279 | 1.0 |
|
||
| 2132 |

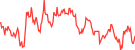
Real-Time Data by Masa
SN42
|
$0,5346 | 0.0% | 0.3% | 3.8% | 11.9% | $36.987,56 | $2.845.550 | $2.845.550 | 1.0 |
|
||
| 2143 |

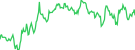
Sundae_Bar
SN121
|
$0,8672 | 0.1% | 0.3% | 5.8% | 26.8% | $94.983,15 | $2.808.912 | $2.808.912 | 1.0 |
|
||
| 2149 |

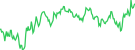
True Performance Network
SN65
|
$0,5492 | 0.0% | 0.8% | 16.7% | 12.6% | $40.913,70 | $2.790.935 | $2.790.935 | 1.0 |
|
||
| 2154 |

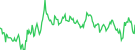
BitAgent - Rizzo
SN20
|
$0,5806 | 0.0% | 0.1% | 2.4% | 16.5% | $37.866,51 | $2.778.234 | $2.778.234 | 1.0 |
|
||
| 2165 |

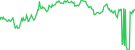
Talisman AI
SN45
|
$0,5641 | 0.0% | 0.3% | 4.1% | 29.5% | $19.044,30 | $2.744.624 | $2.744.624 | 1.0 |
|
||
| 2184 |

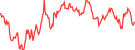
StreetVision by NATIX
SN72
|
$0,5271 | 0.0% | 0.2% | 3.7% | 14.4% | $16.391,68 | $2.679.705 | $2.679.705 | 1.0 |
|
||
| 2249 |

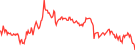
Mantis
SN123
|
$0,5759 | 0.0% | 0.7% | 1.2% | 17.1% | $166.418 | $2.481.402 | $2.481.402 | 1.0 |
|
||
| 2265 |

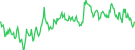
Numinous
SN6
|
$0,5538 | 0.0% | 0.1% | 0.5% | 19.6% | $51.311,44 | $2.420.263 | $2.420.263 | 1.0 |
|
||
| 2282 |

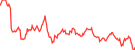
Brain
SN90
|
$4,20 | 3.2% | 3.5% | 12.9% | 38.2% | $257.131 | $2.380.722 | $2.380.722 | 1.0 |
|
||
| 2300 |

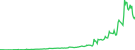
SolMev
SN116
|
$9,28 | 2.7% | 31.9% | 42.6% | 1337.4% | $354.646 | $2.316.978 | $2.316.978 | 1.0 |
|
||
| 2380 |

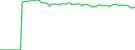
Attune
SN58
|
$2,65 | 3.0% | 6.9% | 6.8% | 51.8% | $74.524,81 | $2.119.658 | $2.119.658 | 1.0 |
|
||
| 2385 |

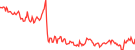
ForeverMoney
SN98
|
$0,5412 | 0.0% | 0.0% | 4.3% | 18.1% | $24.549,15 | $2.104.184 | $2.104.184 | 1.0 |
|
||
| 2418 |

8 Ball
SN125
|
$0,5970 | 0.0% | 0.2% | 6.8% | 29.4% | $38.519,84 | $2.020.535 | $2.020.535 | 1.0 |
|
||
| 2449 |

Cel AI
SN127
|
$0,6242 | 0.0% | 1.3% | 17.3% | 10.8% | $218.163 | $1.966.194 | $1.966.194 | 1.0 |
|
||
| 2469 |

Nodexo
SN106
|
$0,5336 | 0.0% | 0.2% | 15.5% | 15.5% | $38.963,50 | $1.917.003 | $11.205.321 | 0.17107971428571428 |
|
||
| 2512 |

tensorprox
SN91
|
$1,10 | 3.0% | 0.2% | 13.7% | 20.9% | $166.649 | $1.815.667 | $1.815.667 | 1.0 |
|
||
| 2513 |

BetterTherapy
SN102
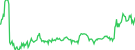
|
$1,10 | 0.0% | 0.4% | 7.3% | 39.1% | $21.313,34 | $1.814.963 | $1.814.963 | 1.0 |
|
||
| 2548 |

ReinforcedAI
SN92
|
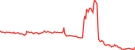
$5,52 | 2.9% | 13.2% | 34.3% | 1077.0% | $979.417 | $1.755.164 | $1.755.164 | 1.0 |
|
||
| 2650 |

Bitsota
SN94
|
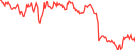
$0,8695 | 0.7% | 1.6% | 21.6% | 38.6% | $134.140 | $1.583.700 | $1.583.700 | 1.0 |
|
||
| 2725 |

Candles
SN31
|
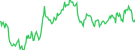
$0,8767 | 0.0% | 3.2% | 10.6% | 28.9% | $6.425,47 | $1.461.526 | $1.461.526 | 1.0 |
|
||
| 2755 |

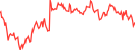
Plaτform
SN100
|
$0,6936 | 0.0% | 2.1% | 4.1% | 36.9% | $74.609,74 | $1.416.604 | $1.416.604 | 1.0 |
|
||
| 2826 |

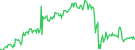
RNA
SN117
|
$0,4667 | 0.0% | 0.4% | 16.3% | 43.5% | $25.253,83 | $1.325.098 | $1.325.098 | 1.0 |
|
||
| 2853 |

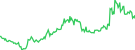
CheckerChain
SN87
|
$0,7965 | 0.1% | 0.8% | 7.9% | 43.7% | $130.119 | $1.293.456 | $1.293.456 | 1.0 |
|
||
| 2883 |

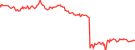
Cognify
SN115
|
$0,5469 | 0.0% | 0.7% | 8.7% | 25.2% | $46.258,37 | $1.258.780 | $1.258.780 | 1.0 |
|
||
| 2928 |

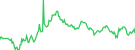
Satori
SN119
|
$0,5442 | 0.0% | 0.4% | 8.3% | 20.8% | $23.921,56 | $1.200.638 | $1.200.638 | 1.0 |
|
||
| 3105 |

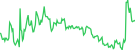
Taoillium
SN109
|
$0,6390 | 0.1% | 4.3% | 17.8% | 10.0% | $430.491 | $1.008.947 | $1.008.947 | 1.0 |
|
||
| 3137 |

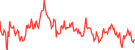
TensorUSD
SN113
|
$0,5519 | 0.0% | 0.3% | 28.3% | 5.7% | $40.603,41 | $976.892 | $976.892 | 1.0 |
|
||
| 3215 |

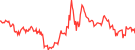
Umi
SN78
|
$0,5624 | 0.4% | 7.7% | 10.2% | 49.0% | $40.752,31 | $900.578 | $900.578 | 1.0 |
|
||
| 3298 |

Docs-Insights (Taτsu)
SN84
|
$0,5453 | 0.0% | 0.4% | 8.2% | 29.1% | $2.949,55 | $832.237 | $832.237 | 1.0 |
|
||
Es werden 1 bis 100 von 118 Ergebnissen angezeigt
Zeilen
Top Bittensor SubnetsKryptowährungen Marktkap-Chart
Das folgende Chart zeigt die Marktkapitalisierung und Dominanz in den Top Bittensor Subnets, einschließlich lium, Chutes, Targon und andere, über einen bestimmten Zeitraum.
Top Bittensor SubnetsKryptowährungen Performance-Chart
Das folgende Chart zeigt die relative Performance von Top Bittensor Subnets Kryptowährungen im Laufe der Zeit und verfolgt ihre prozentualen Gewinne und Verluste in Bezug auf den Kurs über verschiedene Zeiträume.




 Oder schauen Sie sich die App in den App Stores an


