





Carteras
Añadir a la nueva cartera

Seguir
![]() vaya donde vaya
Reciba las novedades en tiempo real mediante notificaciones push en la aplicación.

Abrir aplicación
Las principales monedas Pons Launchpad según la capitalización de mercado
La capitalización de mercado de Pons Launchpad hoy es de 234 millones $, lo que supone un cambio del 4.5% en las últimas 24 horas.
Lo más destacado
$234.064.757
Cap. mercado
4.5%

$27.111.309
Volumen en 24 horas

🔥 En tendencia
| # | Moneda | Precio | 1 h | 24 h | 7 d | 30 d | Volumen en 24 h | Cap. de mercado | FDV | Cap. de mercado/FDV | Últimos 7 días | ||
|---|---|---|---|---|---|---|---|---|---|---|---|---|---|
| 191 |

Pons
PONS
|
$0,2919 | 0.3% | 4.7% | 14.9% | 50.2% | $21.550.970 | $196.432.776 | $196.432.776 | 1.0 |

|
||
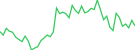
| 1164 |

Priors Agents
PRIORS
|
$0,01218 | 1.2% | 17.5% | 73.2% | 0.0% | $1.361.367 | $11.183.454 | $11.183.454 | 1.0 |
|
||
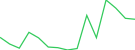
| 1256 |

ZZZ
ZZZ
|
$0,01290 | 0.2% | 2.1% | 30.4% | 59.8% | $1.214.357 | $9.651.201 | $9.651.201 | 1.0 |
|
||
| 1440 |

Thinking Cat
HMM
|
$0,007346 | 3.5% | 6.3% | 22.7% | 34.7% | $1.378.959 | $7.345.623 | $7.345.623 | 1.0 |

|
||
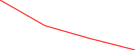
| 1740 |

Wojak
WOJAK
|
$0,004986 | 3.1% | 10.1% | 3.4% | 0.0% | $85.578,85 | $4.579.577 | $4.579.577 | 1.0 |
|
||
| 3104 |

YOLO
YOLO
|
$0,0008831 | 3.5% | 15.4% | 40.1% | 82.0% | $1.020.693 | $883.861 | $883.861 | 1.0 |

|
||
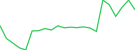
| 3488 |

Kudo
KUDO
|
$0,0008808 | 0.0% | 16.4% | 43.8% | 0.0% | $14.744,04 | $615.154 | $863.229 | 0.7126197419434174 |
|
||
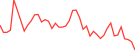
| 3793 |

The Bull
BULL
|
$0,0004490 | 0.0% | 4.0% | 8.5% | 75.1% | $1.127,70 | $449.033 | $449.033 | 1.0 |
|
||
| 3866 |

The Dogestar
SIRIUS
|
$0,0004191 | 0.0% | 69.1% | 51.3% | 11.2% | $35.743,92 | $419.086 | $419.086 | 1.0 |

|
||
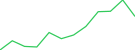
| 3875 |

Robin the Frog
ROBIN
|
$0,0004139 | 3.8% | 14.3% | 14.3% | 87.4% | $129.690 | $413.884 | $413.884 | 1.0 |
|
||
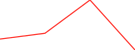
| 3992 |

ur mom
URMOM
|
$0,0004124 | 0.5% | 4.8% | 6.9% | 2.0% | $21.557,15 | $378.718 | $378.718 | 1.0 |
|
||
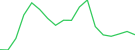
| 4445 |

Sectoral
SECTORAL
|
$0,0002859 | 0.5% | 65.6% | 158.5% | 0.0% | $95.611,19 | $262.545 | $262.545 | 1.0 |
|
||
| 4520 |

HoodLock
LOCK
|
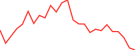
$0,0002507 | 0.1% | 0.1% | 22.9% | 55.0% | $4.223,60 | $250.723 | $250.723 | 1.0 |
|
||
| 4733 |

CrawlScan
CRAWLSCAN
|
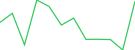
$0,0002319 | 0.2% | 8.2% | 7.4% | 0.0% | $38.610,62 | $212.963 | $212.963 | 1.0 |
|
||
| 5687 |

Verdex
VERDEX
|
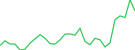
$0,0001088 | 3.2% | 20.6% | 39.0% | 0.0% | $31.912,93 | $107.965 | $107.965 | 1.0 |
|
||
| 5788 |

Packed
PACKD
|
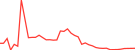
$0,0001060 | 0.0% | 1.1% | 46.0% | 20.1% | $188,44 | $101.302 | $106.021 | 0.9554948440529911 |
|
||
| 6167 |

ND4.eth
ND4
|
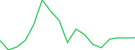
$0,00009226 | 0.0% | 2.1% | 0.5% | 61.9% | $601,53 | $80.296,73 | $80.296,73 | 1.0 |
|
||
| 6188 |

VEYA
VEYA
|
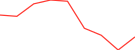
$0,00007931 | 0.1% | 21.8% | 42.8% | 0.0% | $8.994,22 | $79.310,59 | $79.310,59 | 1.0 |
|
||
| 6216 |

Dice Protocol
DICE
|
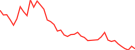
$0,00007999 | 1.6% | 18.1% | 42.6% | 70.9% | $2.929,46 | $77.907,82 | $77.907,82 | 1.0 |
|
||
| 6774 |

Strategic Bitcoin Reserve
SBR
|
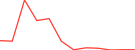
$0,00005351 | 0.0% | 6.1% | 23.4% | 65.1% | $630,09 | $53.507,69 | $53.507,69 | 1.0 |
|
||
| 7039 |

BUNZ
BUNZ
|
$0,00004937 | 1.0% | 9.9% | 7.7% | 0.0% | $732,30 | $45.338,04 | $45.338,04 | 1.0 |
|
||

NEUTON
NEUT
|
$0,00008505 | 0.0% | 7.9% | 13.6% | 26.7% | $555,05 | $44.948,51 | $85.053,50 | 0.5284733971756496 |
|
|||
| 7423 |

UPay
UPAY
|
$0,00003871 | 0.8% | 98.2% | 54.4% | 0.0% | $8.858,78 | $35.554,89 | $35.554,89 | 1.0 |
|
||
| 7613 |

OmniRail
RAIL
|
$0,00003205 | 0.2% | 17.5% | 19.4% | 0.0% | $6.221,89 | $32.053,02 | $32.053,02 | 1.0 |
|
||
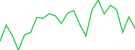
| 7621 |

Snarket AI
SNARKET
|
$0,00003663 | 1.1% | 28.2% | 0.0% | 0.0% | $49.440,70 | $31.828,49 | $31.828,49 | 1.0 |
|
||
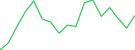
| 7768 |

Cat Purrcessing Unit
CPU
|
$0,00002908 | 0.5% | 26.3% | 6.4% | 68.7% | $1.302,65 | $29.081,77 | $29.081,77 | 1.0 |
|
||
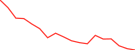
| 7773 |

Shivolink
SLINK
|
$0,00003159 | 0.2% | 0.0% | 16.5% | 34.7% | $63,57 | $29.011,01 | $29.011,01 | 1.0 |
|
||
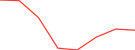
| 7857 |

Nuts
NUTS
|
$0,00002738 | 0.0% | 3.3% | 13.3% | 13.0% | $65,75 | $27.381,70 | $27.381,70 | 1.0 |
|
||
| 7947 |

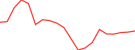
AGENT CITY
AGENT CITY
|
$0,00002674 | 0.0% | 21.6% | 21.0% | 0.0% | $2.577,03 | $26.008,14 | $26.008,14 | 1.0 |
|
||
| 7950 |

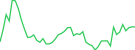
Real World Impact
RWI
|
$0,00002916 | 0.6% | 0.8% | 47.0% | 29.4% | $3.596,68 | $25.976,16 | $25.976,16 | 1.0 |
|
||
| 8051 |

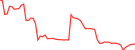
TetraScore
SCORE
|
$0,00002402 | 0.0% | 5.8% | 6.7% | 0.0% | $597,00 | $24.021,17 | $24.021,17 | 1.0 |
|
||
| 8193 |

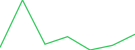
SECONDED
SECONDED
|
$0,00002693 | 0.0% | 0.5% | 22.4% | 0.0% | $3.683,38 | $21.556,97 | $23.755,09 | 0.9074671730173313 |
|
||
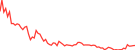
| 8209 |

Commodity Market Exchange
CME
|
$0,00002488 | 0.0% | 2.2% | 17.2% | 99.4% | $181,36 | $21.379,60 | $24.744,16 | 0.864026107749661 |
|
||
| 8338 |

wire bot
WIRE
|
$0,00001941 | 0.1% | 2.3% | 2.1% | 69.2% | $118,46 | $19.407,64 | $19.407,64 | 1.0 |

|
||
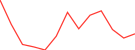
| 8559 |

NockAI
NOCKAI
|
$0,00001666 | 0.4% | 14.0% | 62.6% | 0.0% | $1.260,35 | $16.663,74 | $16.663,74 | 1.0 |
|
||
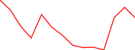
| 8636 |

fren
FREN
|
$0,00001707 | 0.5% | 0.1% | 12.5% | 30.3% | $60,80 | $15.672,13 | $15.672,13 | 1.0 |
|
||
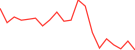
| 8756 |

Veilora
VEIL
|
$0,00001699 | 1.6% | 15.6% | 0.0% | 0.0% | $2.927,79 | $14.344,55 | $14.344,55 | 1.0 |
|
||
| 8798 |

daHood
DAHOOD
|
$0,00001743 | 2.0% | 5.9% | 6.5% | 27.4% | $178,26 | $13.928,41 | $13.928,41 | 1.0 |

|
||
| 8876 |

Hooja
HOOJA
|
$0,00002878 | 0.1% | 4.8% | 1.4% | 27.0% | $38,38 | $13.102,40 | $13.102,40 | 1.0 |

|
||
| 9058 |

CoresRent
CORES
|
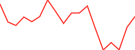
$0,00001312 | 2.0% | 8.6% | 74.9% | 0.0% | $1.570,28 | $11.657,14 | $11.657,14 | 1.0 |
|
||
| 9229 |

Glimmerguard
GLIM
|
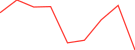
$0,00001323 | 0.0% | 27.6% | 6.2% | 0.0% | $1.748,45 | $10.185,02 | $10.185,02 | 1.0 |
|
||
| 9235 |

KERMIT
KERMIT
|
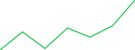
$0,00001120 | 0.0% | 1.5% | 23.8% | 16.3% | $154,87 | $10.117,90 | $10.117,90 | 1.0 |
|
||
| 9283 |

Tada
TADA
|
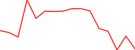
$0,00001141 | 2.8% | 31.3% | 0.0% | 0.0% | $21.798,56 | $9.804,97 | $9.804,97 | 1.0 |
|
||
| 9320 |

XCoins
XCOINS
|
$0,00001048 | 0.0% | 2.8% | 3.0% | 56.2% | $42,86 | $9.503,33 | $10.358,70 | 0.9174244576924035 |
|
||
| 9362 |

Imagine
IMAGINE
|
$0.059196 | 0.0% | 2.9% | 4.5% | 71.9% | $18,44 | $9.196,07 | $9.196,07 | 1.0 |
|
||
| 9470 |

daemon
DAEMON
|
$0.059252 | 2.3% | 28.3% | 87.2% | 0.0% | $944,07 | $8.497,09 | $9.252,39 | 0.9183673469387756 |
|
||
| 9558 |

Advanced Micro Dog
AMD
|
$0.057979 | 0.6% | 9.6% | 8.5% | 91.1% | $2,00 | $7.970,28 | $7.970,28 | 1.0 |
|
||

Kansoku Labs
KANSO
|
$0.057416 | 0.0% | 1.3% | 11.9% | 20.3% | $50,70 | $7.415,83 | $7.415,83 | 1.0 |

|
|||

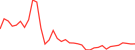
MUSE
MUSE
|
$0.057986 | 0.0% | 1.8% | 13.5% | 41.0% | $20,17 | $7.334,00 | $7.334,00 | 1.0 |
|
|||

Market Cat
MARKETCAT
|
$0.057036 | 0.0% | 0.4% | 10.7% | 41.2% | $1,25 | $7.035,94 | $7.035,94 | 1.0 |

|
|||
| 9723 |

NASDANQ
NASDANQ
|
$0.056872 | 0.1% | 3.7% | 18.7% | 99.5% | $34,40 | $6.872,40 | $6.872,40 | 1.0 |

|
||
| 9754 |

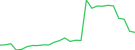
Fomo Bag Dollar
FOMOBAG
|
$0.056705 | 0.0% | 3.2% | 66.6% | 98.5% | $10,34 | $6.704,78 | $6.704,78 | 1.0 |
|
||
| 9885 |

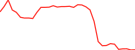
Hoodfarm
HFARM
|
$0.056676 | 0.0% | 13.5% | 16.3% | 76.3% | $312,97 | $5.862,35 | $6.676,05 | 0.8781173139879612 |
|
||
| 9937 |

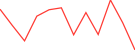
Brain Chain Interface
BCI
|
$0.057025 | 0.0% | 3.1% | 56.0% | 0.0% | $114,30 | $5.605,28 | $5.605,28 | 1.0 |
|
||
| 10008 |

BODKIN
BODKIN
|
$0.055650 | 0.0% | 2.3% | 8.6% | 58.1% | $3,77 | $5.188,59 | $5.188,59 | 1.0 |
|
||
| 10034 |

Arc Finance
ARC
|
$0.055652 | 0.0% | 2.1% | 1.0% | 43.1% | $1,34 | $5.074,54 | $5.074,54 | 1.0 |
|
||
| 10086 |

Minera
MNRA
|
$0.055023 | 2.3% | 13.4% | 0.0% | 0.0% | $591,25 | $4.817,41 | $4.921,88 | 0.9787726561479259 |
|
||

HOP
HOP
|
$0.054249 | 0.0% | 2.5% | 1.8% | 93.5% | $1,70 | $3.901,72 | $3.901,72 | 1.0 |
|
|||

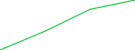
Kerf
KERF
|
$0.054229 | 0.0% | 5.2% | 19.2% | 94.0% | $32,75 | $3.819,70 | $3.819,70 | 1.0 |
|
|||
| 10337 |

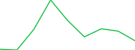
OgeePerps
OGEE
|
$0.054343 | 0.0% | 5.2% | 12.7% | 0.0% | $1,42 | $3.684,44 | $3.684,44 | 1.0 |
|
||

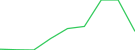
ROBODOG
ASTRO
|
$0.052737 | 0.0% | 1.0% | 77.4% | 93.5% | $1,89 | $2.736,92 | $2.736,92 | 1.0 |
|
|||

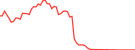
POOLED
POOLED
|
$0.055191 | 0.0% | 6.2% | 6.2% | 0.0% | $5,02 | - | $4.447,17 |
|
||||

Stepper CPU
STEP
|
$0.054278 | 0.0% | 4.5% | 15.8% | 59.2% | $1,51 | - | $4.277,69 |
|
||||
Mostrando resultados 1 a 63 de un total de 63
Filas
Gráfico de cap. de mercado de las principales monedas Pons Launchpad
El siguiente gráfico muestra la capitalización de mercado y el dominio de las principales Pons Launchpad, entre ellas Pons, Priors Agents, ZZZ, etc. durante un periodo de tiempo.
Gráfico de rendimiento de las principales monedas Pons Launchpad
El siguiente gráfico muestra el rendimiento relativo de las principales monedas Pons Launchpad a lo largo del tiempo. Para ello, tiene en cuenta sus ganancias y pérdidas porcentuales en términos de precio en diferentes periodos.


 O búsquela en las tiendas de aplicaciones


