
Key Takeaways
-
Flags are distinct shapes formed on asset development charts that hint at the next major price move for that asset.
-
Flag patterns attain the shape of a flag when the peaks and bases of the candles are formatively drawn. The pattern could also give a hint about the expected extent of the anticipated move.
-
Spot and derivatives traders study the flag patterns and other indicators as part of their trading analysis and as a means to move ahead of the market and generate profits.
-
The bull flag is an indicator of a probable uptrend. It is characterized by a visible attempt by the asset to break out of its current resistance. The bull flag is a standing flag.
-
The bearish flag indicates a likely drop in price as the asset pattern shows attempts to stay above current levels. The bear flag is inverted.
-
Other indicators like RSI and MACD are also used to measure the momentum of the asset to continue in its path or take a different price development route. They validate flag and pennant patterns.

As tradable assets listed on digital trading platforms experience price changes, they leave a record of their journey. Traders use advanced trading platforms to record these changes and visualize them as informative diagrams that illustrate the trading history of an asset in a bid to predict future price movements.
Traders have identified certain patterns that precede notable price movement, regarding these as an indicator of coming trends. A popular example of this is the flag pattern, which can be bearish or bullish.
*Note: The information in this article is for informational purposes only and should not be taken as financial advice.
What are Flag Patterns?
If you trace the peaks and bases of an asset price development candle with respect to the values of the asset at each level, it’s possible to identify shapes that resemble everyday objects, such as the flag shape and cup and handle, which can be used for trading analysis.
The flag pattern usually forms when an asset consolidates from a significant uptrend or downtrend. The consolidation is found to precede a move back to the former levels and even further. The flagpole is the single (usually longest) candle or the combination of candles that indicates this significant price development event before the consolidation. The flag itself is formed by the candles formed by the asset as it consolidates from its big moves.
The flag pattern, in summary, indicates a waiting period before (probably) another big move. The asset, however, isn’t dormant but continues to test its support as it seeks to break out. Flag patterns can attain three distinct structures; a range, channel, or wedge structure. The structure of the flag is formed by the consolidation candles.
A Range Flag
A range flag pattern is formed when the sideways consolidation moves are within the same severity; say a consistent drop and spikes of the same price difference. A balanced horizontal flag is indicative of a range flag.
The Channel Flag
The channel flag pattern takes an oblique form. The flag pattern slants due to a slope caused by candles of different severity retracing from the support or straying below the resistance. In the case of the former, the flag channel is ascending, for the latter, it is descending.
The Wedge Flag
For the wedge flag, the consistently decreasing severity of the consolidation patterns tapers towards the break-out level.
The above flag patterns can be either bullish or bearish.
The Bullish Flag Pattern
The bull flag precedes an uptrend. Bull flags are consolidation patterns that suggest that the asset’s next significant move is toward an increase in value.
The bull flag formation goes as follows; a sudden strong upward movement followed by alternating, repeating, and relatively weaker upward and downward moves that continue at levels below the peak of the stronger movement. The price consolidation forms the flag’s fly while the movement that precedes it forms the pole of the flag. If the breakout is successful, the asset surges to a new high.
The bull flag pattern depicts an upwards flag with the preceding strong upward movement candle or candles forming the standing flag pole.
How to Identify a Bull Flag Pattern
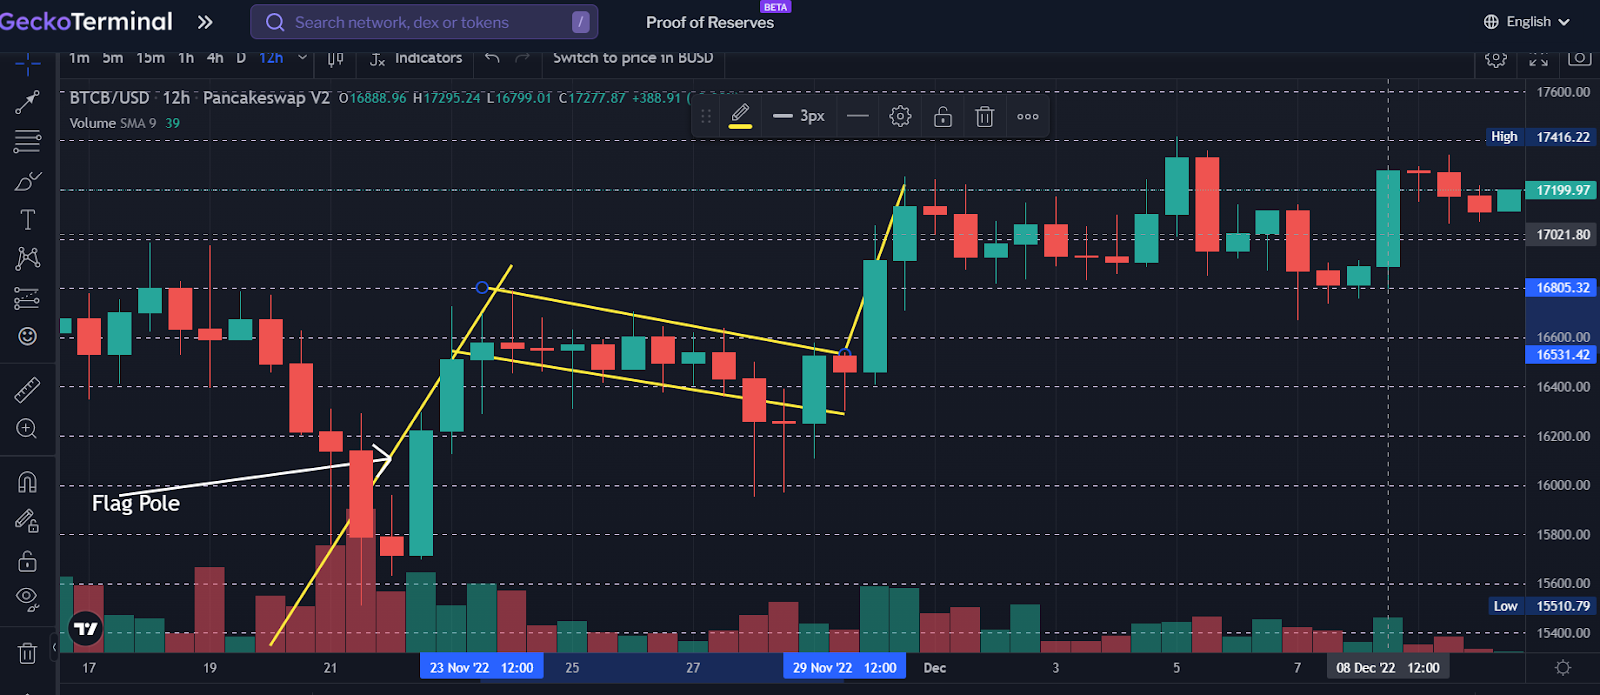
The description offered above for the flag is in fact a pattern obtained in a perfect situation. In reality, a perfect flag pattern hardly occurs, although the formation sequence remains the same. We will take the below BTC/BUSD chart as an instance and draw our pattern using this chart.
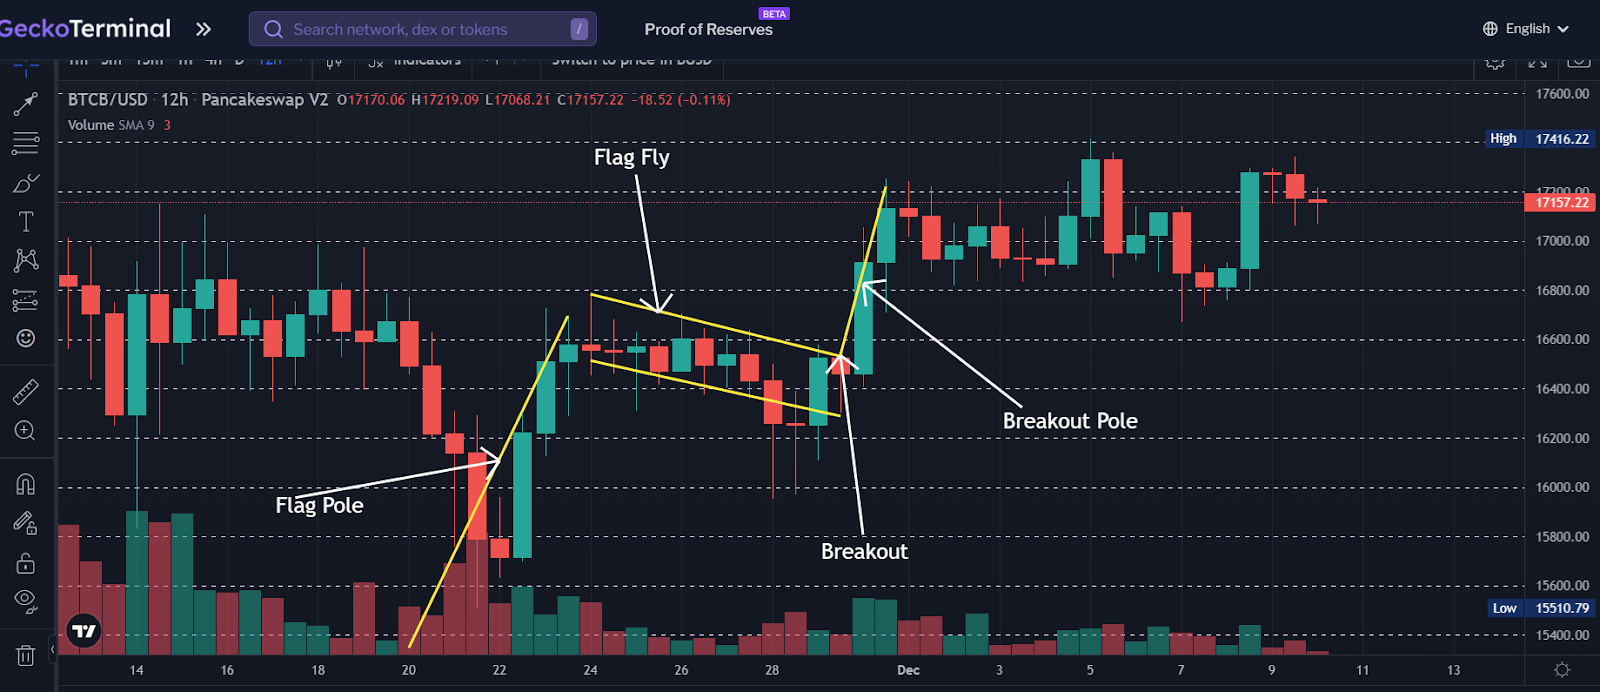
In this chart, bitcoin’s uptrend from November 22nd saw the price climb above $16,700 from a low of $15,700. The raging $1,000 gain was halted as the price dropped to $16,600 from the $16,700 level. Alternating and relatively weaker sideways movement saw the price go to a low of $16,200 as the price consolidated forming a range bull flag. The consolidation was brought to an end by a breakout at the $16,518 price point as bitcoin climbed to a new high of $17,225.
The growth from $15,700 to $16,700 is the flag pole while the level from $16,600 to $16,500 is the flag fly. The flag pattern is completed at the breakout point and the extent of the breakout is represented by the breakout pole.
The BTCB/BUSD pattern is a complete instance. In an actual use case, the pattern is detected while it's in progress and the flag is completed by the trader using his expectations after considering certain price development factors.
How Traders Use the Bull Flag
Identifying a bull flag is one part of the task, the other and equally important task is to justify the identified pattern and devise a trading move using the data. Traders consider the authenticity of the flag and the probability that the flag breaks out from the consolidation levels. The breakout could go either way; bull flags could skew into a bearish breakout. To stand a chance of making the right decision as regards the asset’s next big move, traders include previous charts analysis and the current state of the general market.
If the trader decides to follow the pattern, he takes a long position on the asset on a derivatives trading platform or simply buys the asset on the spot market and waits until it breaks out.
Bearish Flag Pattern
The bear flag takes the form of a flag, just like the bull flag. Unlike the bull flag, however, the bear flag is usually inverted and the breakout continues the asset’s nosedive. The bear flag precedes a downtrend. It presents a pattern formed by an asset’s significant downtrend, a cool-off period, and a moment of relatively weak attempts towards a breakout above the support level.
Here’s how the bear flag forms; a sudden strong downward movement followed by a series of alternating, repeating, and relatively weaker upward and downward moves that continue at levels below the support levels. The price consolidation forms the flag’s fly while the movement that precedes it forms the pole of the flag. If the breakout is successful, the asset falls to a new low.
The bear flag pattern depicts an inverted flag with the preceding strong price drop candle or candles forming the inverted flag pole.
How to Identify a Bear Flag Pattern
The bear flag follows a significant price drop, in a normal scenario, traders seek to identify this pattern when contemplating the possibility of an asset’s price dropping further after a cool-off.

Once again, looking at the BTC/BUSD pair.
On the one-year chart, bitcoin slumps from levels above $47,000 on May 16, 2022, to levels below $20,500. This nosedive forms the flagpole. From this point, the price consolidates above the $20,500 support level.
The alternating candles between the $21,000 and $25,000 levels form the flag fly. Bitcoin’s charge above the level came to an end when the price dropped from $25,000 to $24,300 on August 13, 2022. Following the breakout, the price crash continued as bitcoin reached a new low of $19,671. The bear flag formed here is the wedge type.
How Do Traders Use the Bear Flag?
An asset charging upwards above the support level after a significant drop is usually perceived as a relief and traders are made to think that the asset will continue moving upwards and eventually recover and even go further above the previous high. While this works sometimes, other times, it is just a short calm period before the asset continues dropping further below. This event is what the bear flag represents.
Traders who notice the asset forming this pattern and decide to act accordingly will either take a short position on the asset on a derivatives trading platform, or sell their holdings or positions to stop their loss.
Traders using trading metrics like the flag pattern can automate their trading by using a stop-loss system to set price levels where they wish to exit the market. Traders can set a stop-loss to be able to exit the market with minimal losses if their estimated price development sequence doesn’t work. The trader can also set a level where they wish to exit the market and preserve their profit in case the market moves in their favor.
Setting Stop-Loss and Take-Profit Levels
Stop-losses are risk management strategies. Setting up this system in spot or derivatives trading platforms not only helps you manage risks but automates your trading as well. Stop-loss and take-profit levels let a trader set automated exit levels at which they sell their positions or assets to preserve their profits or stop their running loss.
To set a stop-loss or take-profit level for your trade, consider some factors personal to you and particular to the asset as well. For volatile assets, setting an exit level would require properly considering the asset’s ability to swing across price levels in short intervals. Also, consider the viability of the asset, including the liquidity and the spread across price levels. Generally, take-profit orders are more likely to be executed if they are placed a bit lower or at the resistance zone, while stop-losses should be placed below the identified resistance zone.
What are Pennants?
Another pattern similar to the flag pattern is the pennant pattern. The usual pennant pattern has a striking resemblance with the wedge flag pattern. Pennants are a variant of the flag pattern, with a major difference being the speed at which pennants develop and the intensity of their breakout.
The pennant pattern generally takes less time to develop, and is relatively brisker with patterns showing more intensity and ‘suddenness’ than the flag pattern and its closely related wedge flag pattern. This forms a long pole with a sharply alternating consolidation pattern preceding the breakout which is followed by an even longer pole as the asset continues to charge upwards.
Momentum Indicators
Momentum indicators measure the ability (or probability) of an asset to move below its current support or break through its resistance level. Momentum indicators reflect the trade statistics and the chances that the market regards the asset as undervalued or overvalued. A low momentum is indicative of an overvalued asset. Overvalued assets, which are considered to be trading above values comparable to the fundamentals of the issuing company or its underlying technology, are said to be “overbought” and are more likely to correct. For cryptocurrencies, an overvalued token or coin controls a market cap larger than expected for the utility it offers or its current adoption rate.
Assets considered to be oversold or undervalued have high momentum, this hints at an "unfair" sale rate, considering the fundamentals of the asset. Assets with a high momentum value are more likely to increase in value as the market moves.
Measuring the momentum of an asset gives a hint on whether it will continue in its uptrend and is rising in value, or if its movement will take a different turn as the market sentiments change. Therefore, momentum indicators are very effective when used in combination with the bull pattern for trading analysis.
RSI (Relative Strength Index), MACD (Moving Average Convergence/Divergence), and CCI (Commodity Channel Index) are some handy momentum indicators.
RSI (Relative Strength Index)
Created by Welles Wilder in 1978, the Relative Strength Index assigns values between 0 and 100 to tradable assets as a measure of their trading strength and likelihood to pursue a rise in value, decline in value, or continue in their current path.
The RSI of crypto assets can be obtained using GeckoTerminal. You can set up RSI by visiting http://geckoterminal.com, and searching for your token. Click ‘Indicators’ and Search for “Relative Strength Index”
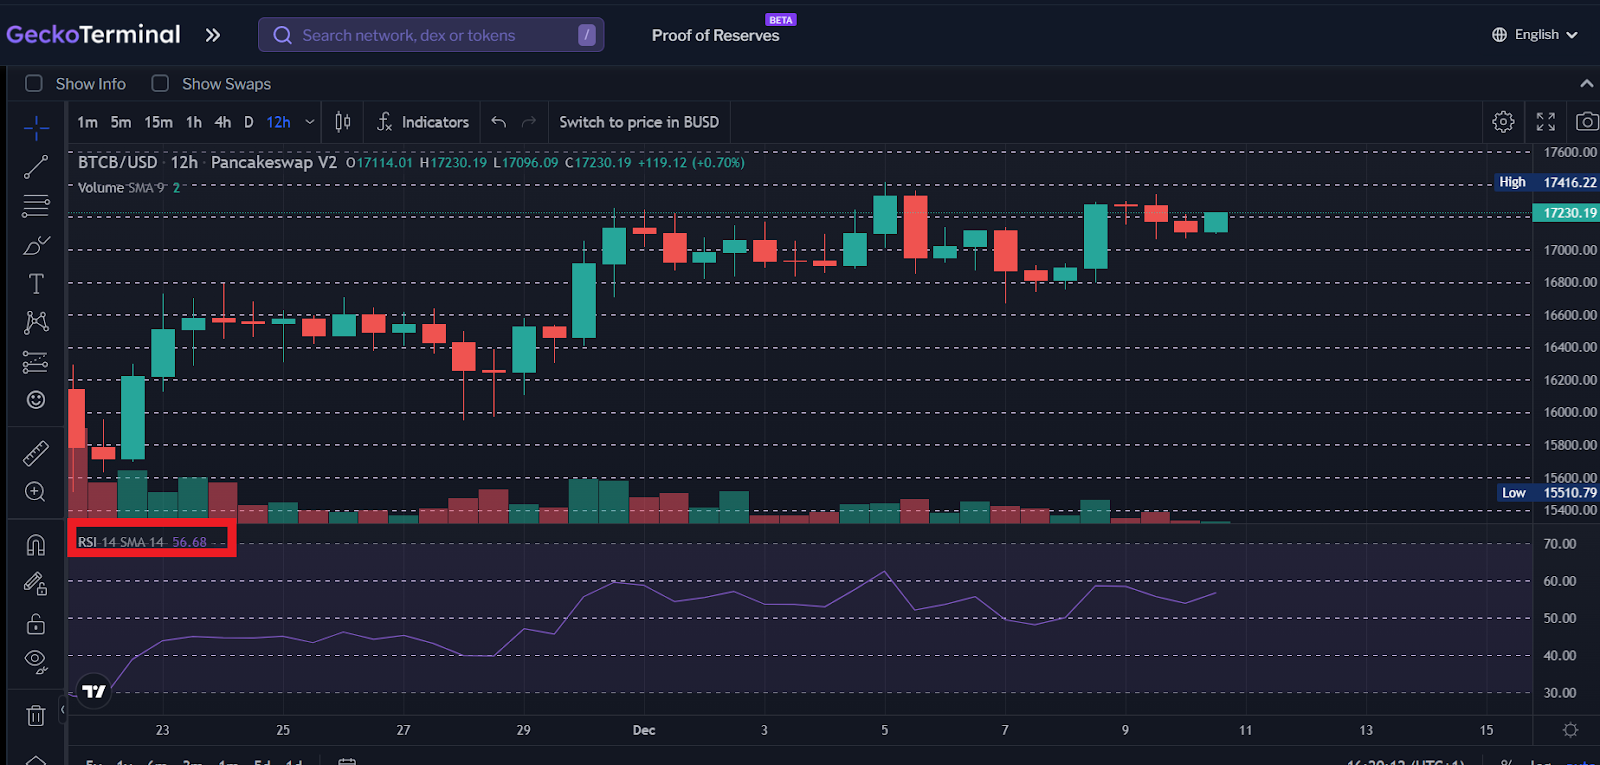
RSI is usually calculated on a daily basis and takes into consideration the previous closing level of an asset. The “relative strength” of an asset is the ratio of the number of days it closed on a high against the number of days it closed on a low. The relative strength is used to derive the relative strength index.
An RSI of 70 and above is indicative of high strength and a possibility that the asset is overbought. An RSI of 30 and below shows a relatively weak asset and is indicative of the asset being oversold. The price of an asset at an RSI of 50 is popularly regarded as its support level or resistance level, within this level the RSI and the price could swing towards weak or strong levels.
An RSI can be used as an indicator of divergence. For RSI this occurs when an asset moves against the RSI indications, which can be either bullish or bearish.
In a bullish RSI divergence, RSI shows an oversold reading followed by a higher low, and concurrently, the price prints a lower low. In a bearish RSI divergence, RSI shows an overbought reading followed by a lower high and simultaneously price prints a higher high.
MACD (Moving Average Convergence/Divergence)
The MACD helps to identify stages in price development where trends are accelerating. For an asset moving up in price, the MACD helps to identify the levels where a longer green candle might appear. The MACD is calculated by subtracting the 26-period EMA (Exponential Moving Average) from the 12-period EMA.
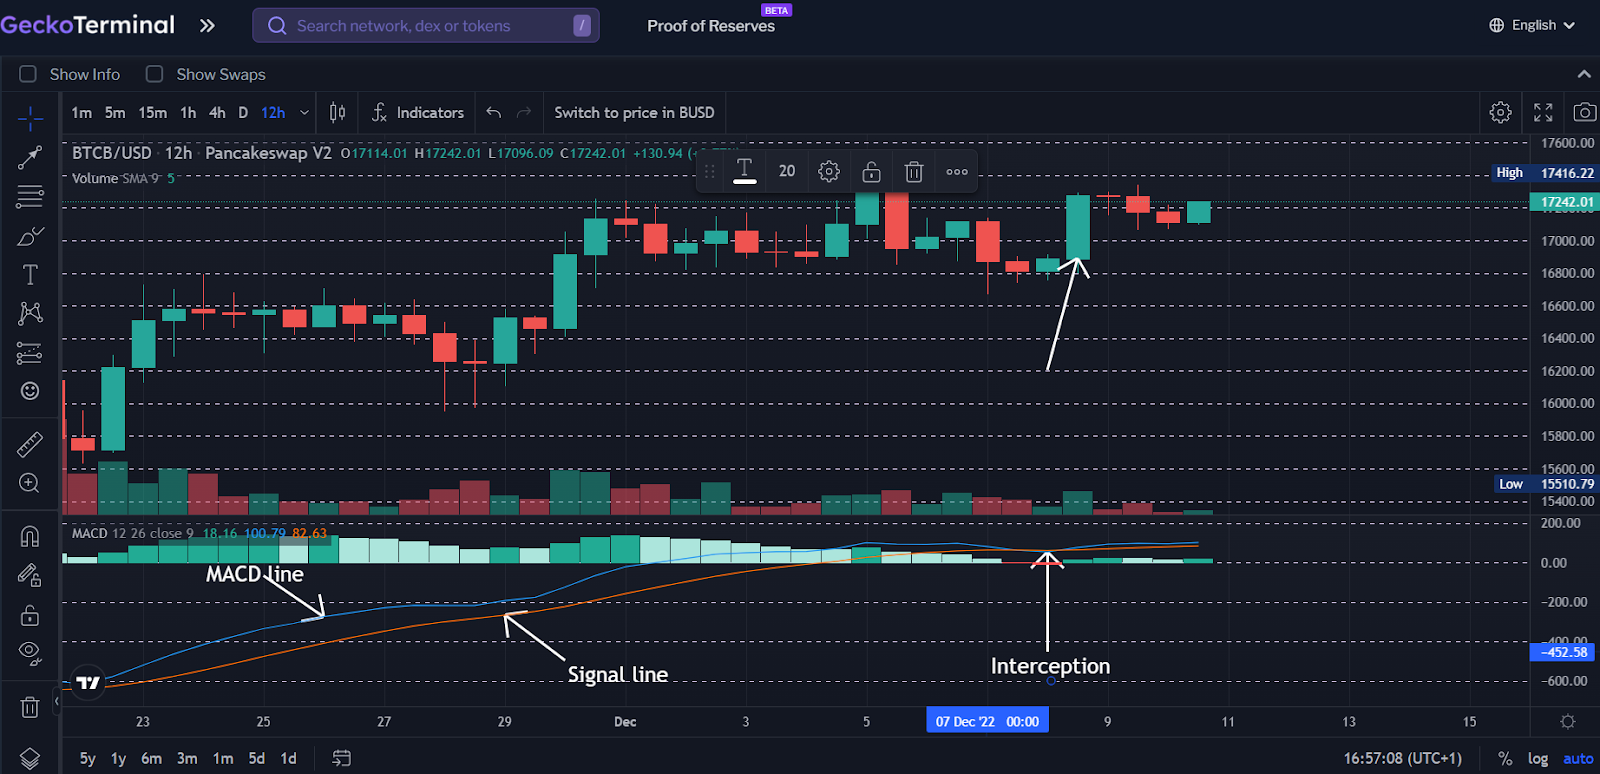
The 26-period EMA represents the long-term EMA while the 12-period EMA represents the short-term EMA. When both EMAs are subtracted, the result is the MACD line. The MACD line is plotted alongside the 9-day EMA of the MACD line. The 9-day EMA of the MACD line is known as the signal line. Both lines when plotted together (signal line above the MACD line), can serve as an indicator for buy and sell signals depending on whether the MACD line crosses above the signal line (buy) or falls below it (sell).
The lines of MACD interception with the asset’s price are indicative of a high chance that the asset moves with a higher intensity in its uptrend or downtrend. The MACD can also indicate bullish and bearish divergences.
CCI (Commodity Channel Index)
The CCI is a measure of an asset’s current price against the determined average. The CCI helps traders to determine whether an asset is oversold or overbought and decide on trading the asset or simply refraining from trading.
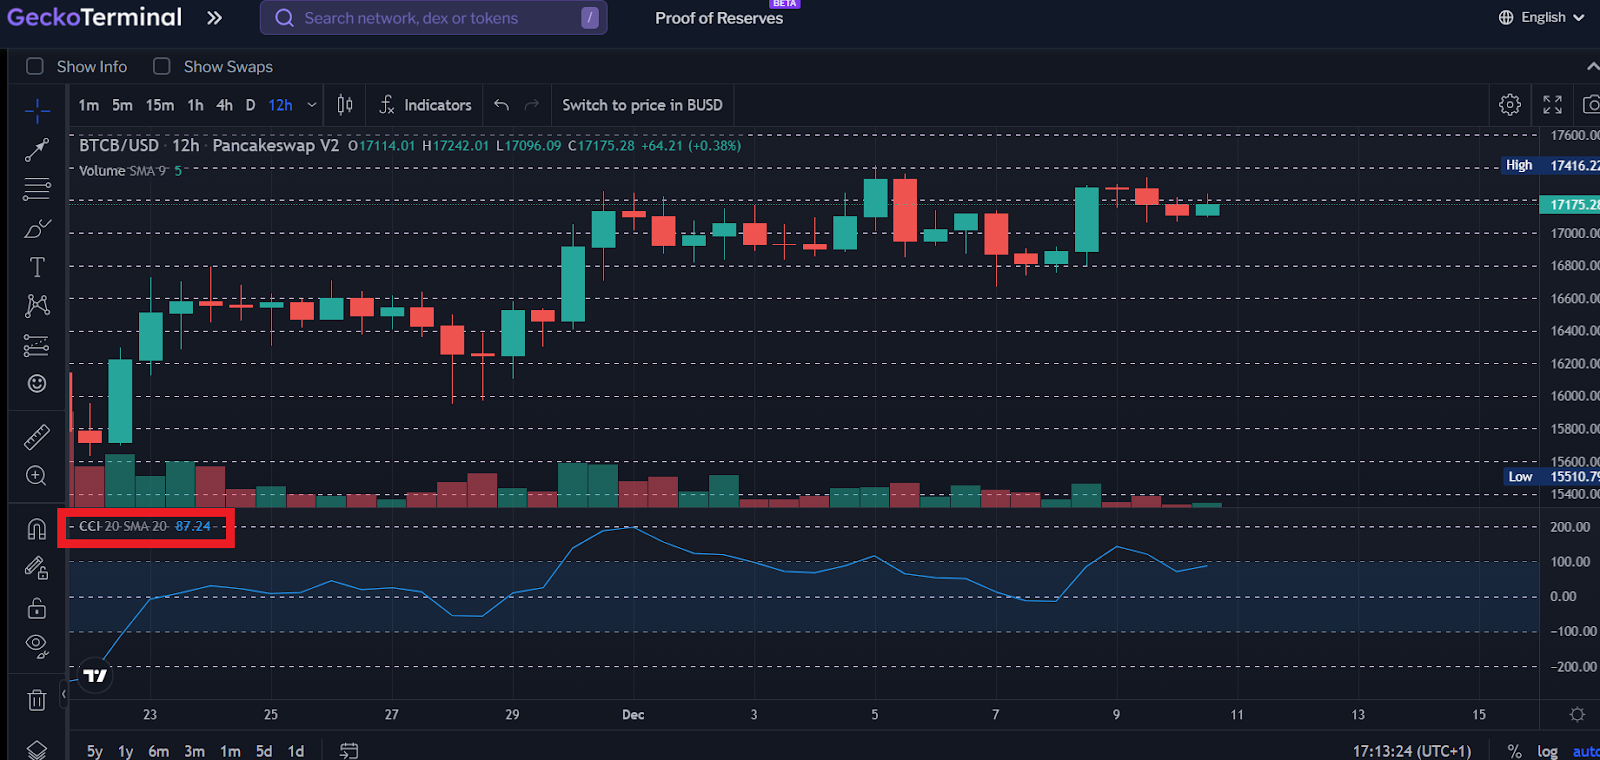
The CCI takes into consideration a certain number of trading days (usually specified by the trader or analyst) and takes a measure of the average closing prices and levels and derives an index using the Moving Average (MA), the deviation of the prices within the selected period from the calculated mean and the current price of the asset.
A CCI change from zero levels above 100 may be indicative of an asset gaining strength and likely to move upwards. When this change is detected traders can start watching the price development closely for s significant change in trend.
Final Thoughts
The charts form periodically repeating patterns of an asset’s price developments, and your routine trading journey most likely involves taking leads from these bullish and bearish patterns as they develop.
However, only relying on patterns for decision-making results in a wide margin of error. This is where additional external factors come into play, as taking these into account will help reduce your error margin by providing a more comprehensive picture of the market. At the same time, it is also important to apply risk management techniques to reduce the risk of unmanageable losses.
As always, be careful and do your own research when investing in cryptocurrencies.


 Or check it out in the app stores

