
Technical analysis is a method used in financial markets to predict future price movements of assets by analyzing historical market data. It focuses on price and volume patterns, and operates on the assumption that the price reflects all available information, moves in trends and tends to repeat historical patterns.
In today’s guide, we’ll cover:
- How to import historical Bitcoin price data into Google Sheets with an API
- How to import historical Bitcoin price data into Google Sheets with a CSV
- How to perform a technical analysis on Bitcoin, to develop a Bitcoin price prediction for the upcoming halving
With much ground to cover, let’s jump right in!
How to Import Bitcoin Historical Prices into Google Sheets (with an API)
Follow these steps to import historical Bitcoin price into Google Sheets:
- Install an API connector on Google Sheets.
- Generate your CoinGecko API key.
- Input your request URL and API key into the API connector.
- Run the query and organize the data.
- Set up a refresh schedule or manually refresh to update the data.
Note: You will require a paid CoinGecko API plan to import more than one year of historical price data.

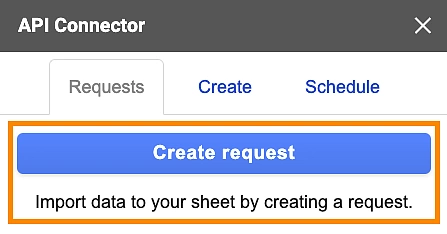
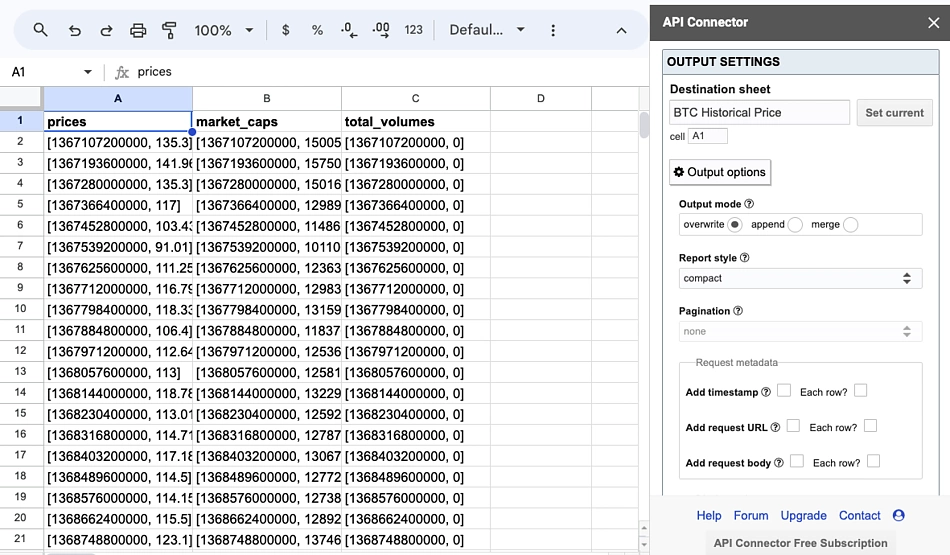
For this tutorial, we’ll be using the API connector by Mixed Analytics. After installing the API connector add-on on Google Workspace Marketplace, run the extension from Google Sheets > Extensions.
Create a request to import data accordingly.
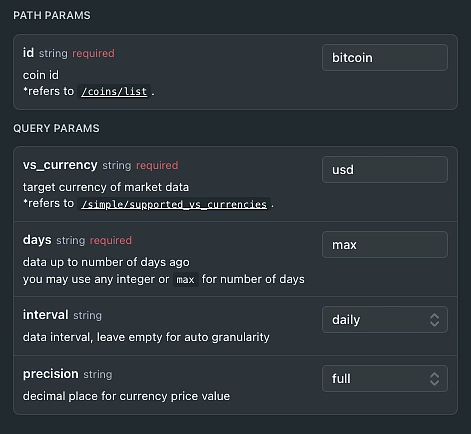
Navigate to the Coins Historical Chart Data by ID endpoint on CoinGecko API's documentation. Fill in the parameters accordingly to derive the request URL.
- id: bitcoin
- vs_currency: usd
- days: max
- interval: daily
- precision: full
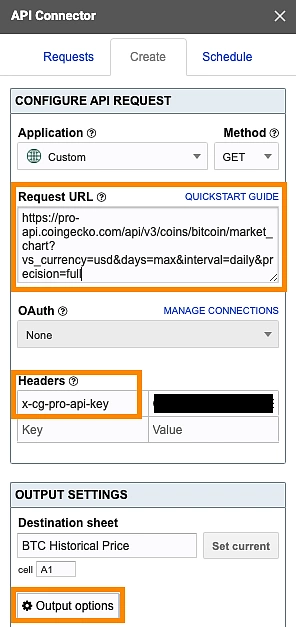
Enter your Pro API key under the key Header authorization section and copy the Request URL. It should be:
https://pro-api.coingecko.com/api/v3/coins/bitcoin/market_chart?vs_currency=usd&days=max&interval=daily&precision=full
Feed this request URL back into the API connector. Under ‘Headers’, fill in the following:
- Key: x-cg-pro-api-key
- Value: Your API key (i.e. CG-XXXXXXXXXXXXXXXXXXXXXXXX)
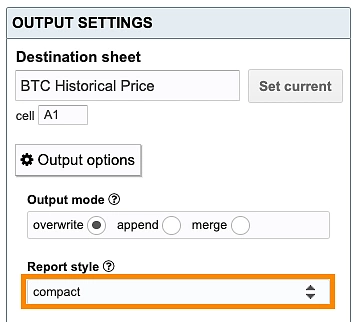
Next, select ‘Output options’ to expand the settings, and update the report style to ‘compact’.
Run the query and you’ll see Bitcoin (BTC) historical price data imported into Google Sheets, in the following format:
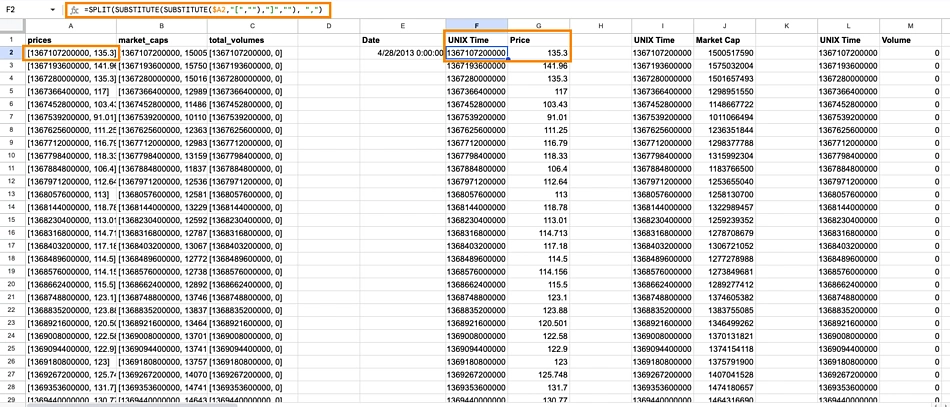
Each cell under prices, market_caps and total_volumes contain nested data within the ‘[ ]’ brackets. The first value within the bracket displays the Unix time for that corresponding price, market cap and trading volume. The second value within the bracket shows the Bitcoin price, market cap and trading volume for that corresponding Unix time.
To convert Unix to a human-readable date, we’ll first split the cell values for row A (prices) by applying the following formula in cell F2.
=SPLIT(SUBSTITUTE(SUBSTITUTE($A2,"[",""),"]",""), ",")
Repeat the following for rows B (market_caps) and C (total_volumes), applying the formula for all cells in the column.
To convert Unix time to a human-readable date, we’ll apply the formula =EPOCHTODATE().
From the screenshot below, we can see that the date for the first Bitcoin price and market data is captured on April 28, 2013 at 0:00:00 UTC.
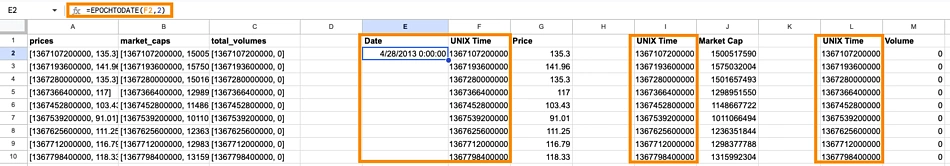
Similarly, apply the EPOCHTODATE() formula on all cells in column E, to convert Unix time for the imported data.
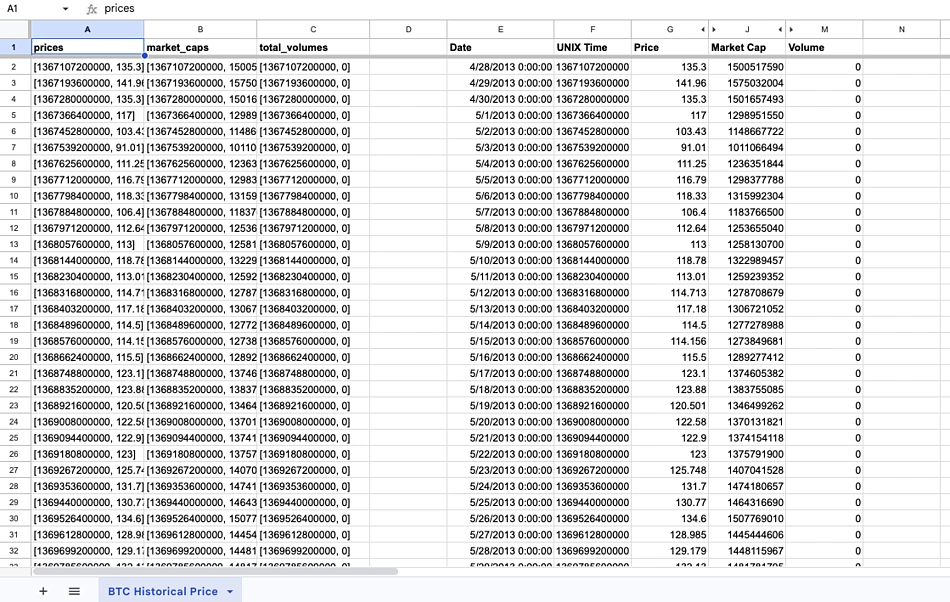
Since the corresponding Unix time is the same across Price, Market Cap and Volume, we can hide the subsequent repeated columns.
Finally, we have an organized data set for historical Bitcoin (BTC) price in Google Sheets.
CoinGecko users can enjoy a 30% off lifetime MixedAnalytics subscription by applying the code "COINGECKO" when installing the integration.
You may also look to duplicate this integration for other cryptocurrencies for technical analysis.
We’ll now look at another way to import historical Bitcoin price data into Google Sheets.
How to Import Bitcoin Historical Prices Data into Google Sheets (with a CSV)
We can retrieve Bitcoin historical price data in Google Sheets through a CSV exported from CoinGecko’s Bitcoin page.
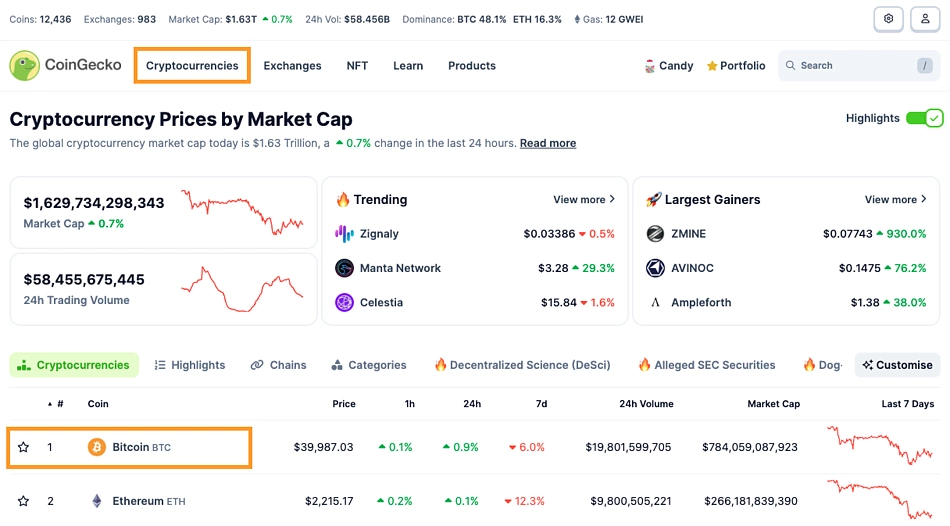
We can access the Bitcoin price page on CoinGecko by clicking on ‘Cryptocurrencies’ from the CoinGecko home page. From there, Bitcoin (BTC) will appear as the top line item when the list of cryptocurrencies are sorted by market cap.
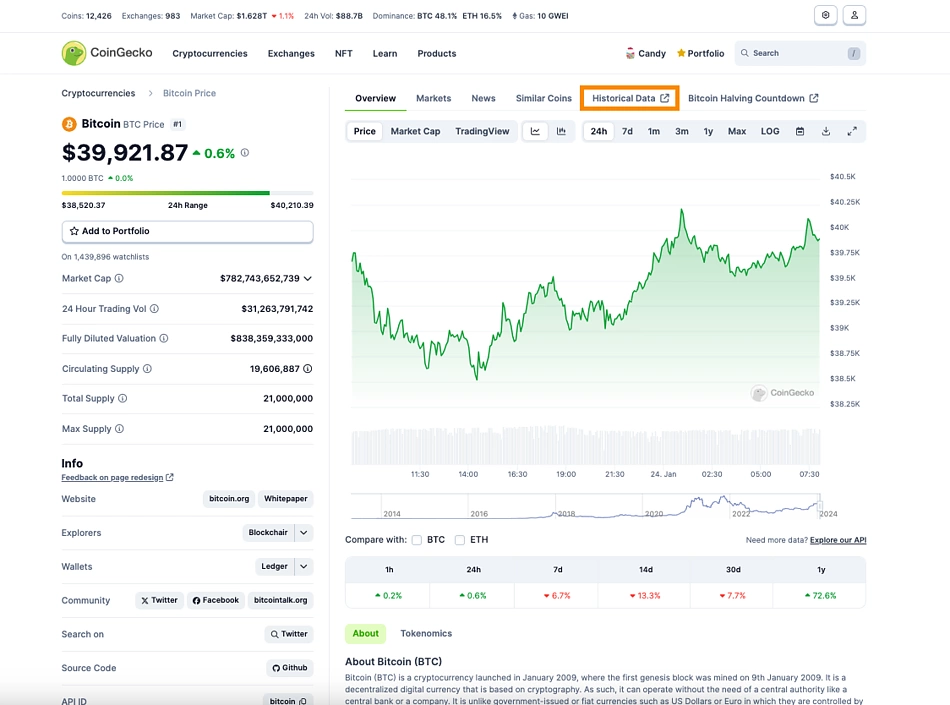
Once you’re on the Bitcoin page, select “Historical data” to view all historical data points for Bitcoin.
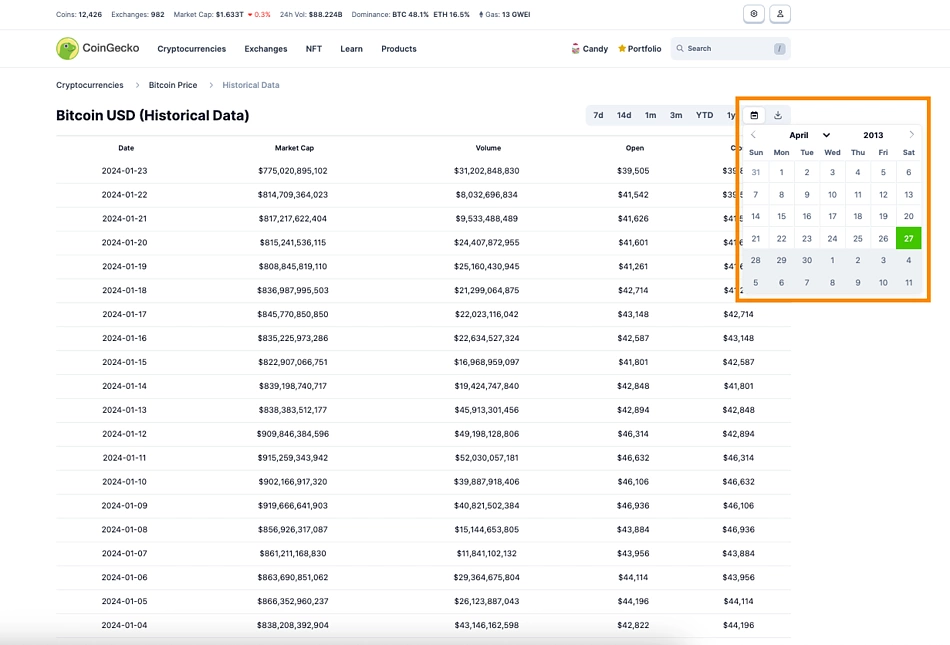
From the Bitcoin historical data page, select the calendar icon at the top right and input your preferred time coverage. Once the data refreshes, tap on the ‘download’ icon next to it to export the historical BTC price data in either the .xls or .csv format.
Create a new Google Sheet, select ‘File’, ‘Import’, and find your .csv file. With that, we have BTC historical data accessible in Google Sheets.
Conducting a Technical Analysis with Historical Crypto Price Data
When conducting technical analysis, specifically chart analysis, the first thing we need to consider is the time frame. We need to zoom out in order to comprehend, for example, what occurs in daily time frames to make predictions in hourly time frames, or monthly time frames for weekly time frames, etc. Off this understanding, we can create an investment thesis that 'invalidates' our perception.
For example, if we think a breakout is going to occur, where the price of a cryptocurrency is going to surpass a former level of resistance, ‘invalidating’ our thesis would be when the price closes below a level X, as opposed to consecutively higher closes. Alternatively, we can form time-based invalidations, suggesting that the price should consecutively close above X to suggest a breakout.
To substantiate these perceptions, we need to identify levels of support and resistance. Resistance levels are prices that the asset struggles to surpass, and support are price levels the asset struggles to drop below. Identifiers of significant price levels that can help us isolate support/resistance include the bottom of a dump, the peak of a rally, an area of recurring tests, and consolidations (sideways movements) between impulsive moves (this Elliott Wave article deep dives into graph terminology).
In the process of identifying levels of support and resistance, we’ll again review data at a higher time frame (i.e. monthly/weekly/daily) to make inferences for lower time frames (daily/intraday). From this, we are looking for confluence, which are significant price points that occur on a multi-timeframe level.
How to Perform a Technical Analysis of Bitcoin
We can perform a technical analysis of Bitcoin by identifying support and resistance levels, using historical price data on Google Sheets.
To conduct a Bitcoin price prediction for April 2024, let’s first go back in time to assess trends during the first Bitcoin halving, which occurred on July 9, 2016.
We’ll start by creating three separate graphs with the data imported earlier:
- Monthly price data for 2016
- Weekly price data for 2016
- Daily price data for 2016
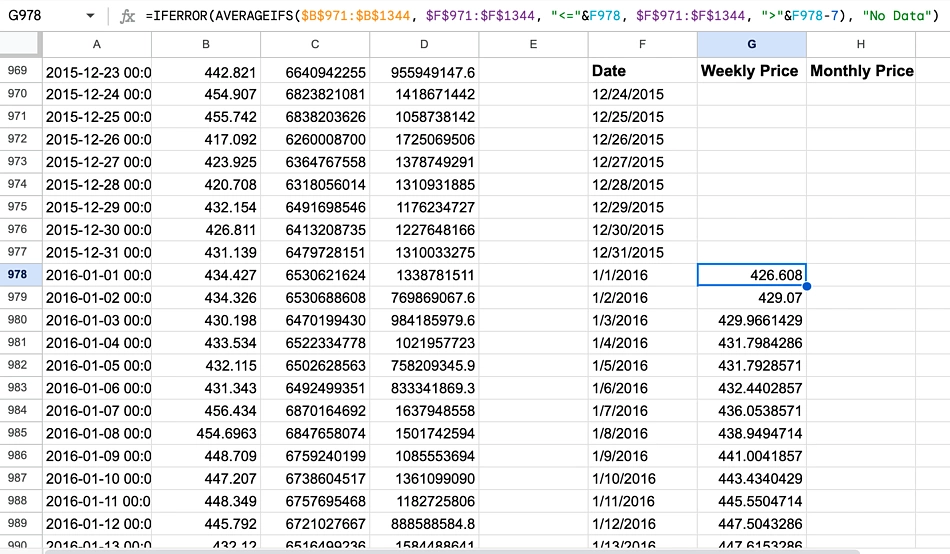
We will need to splice our imputed 'date' column to a numeric form, for us to calculate the monthly and weekly prices. As we are only concerned with 2016, we will start at cell A978, which is 01/01/2016.
With the formula:
=DATE(VALUE(LEFT(A978,4)), VALUE(MID(A978,6,2)), VALUE(MID(A978,9,2)))
We can separate the time values into excel-readable formatting. Then we can calculate the weekly and monthly price data with the following formula, starting in cells G978 and H978 as shown above:
=IFERROR(AVERAGEIFS($B$971:$B$1344, $F$971:$F$1344, "<="&F978, $F$971:$F$1344, ">"&F978-7), "No Data")=IFERROR(AVERAGEIFS($B$971:$B$1344, $F$971:$F$1344, "<="&F978, $F$971:$F$1344, ">"&F978-31), "No Data")
For this, ensure you have created proper 'date' values for the 31 days prior to January 1, 2016 (01/01/2016).
The IFERROR statement is for pre-emptive error handling, in case we had insufficient data to calculate weekly/monthly averages. The AVERAGEIFS statement allows us to calculate moving averages, conditional to the size of our intervals (i.e. weekly and monthly). From there, we can simply input a line graph for both sets of data.
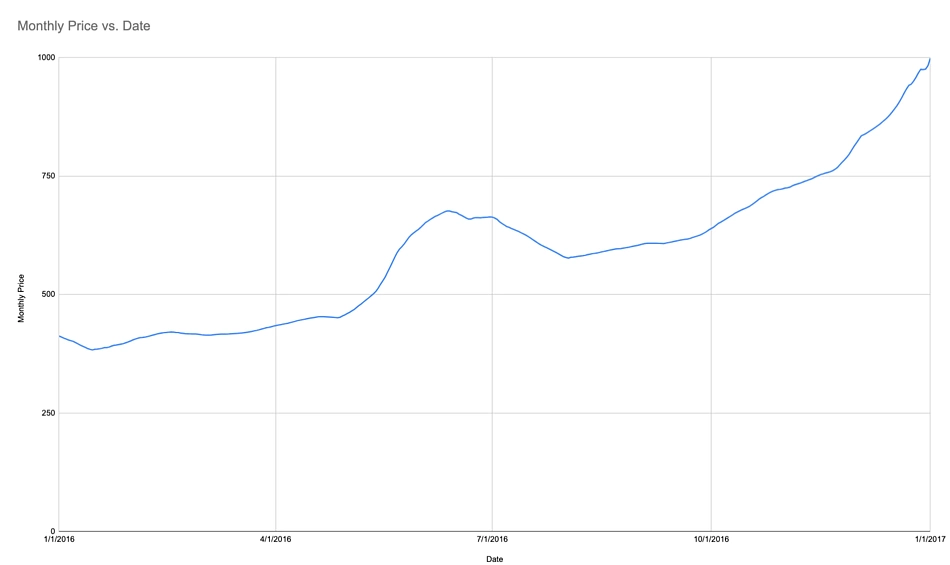
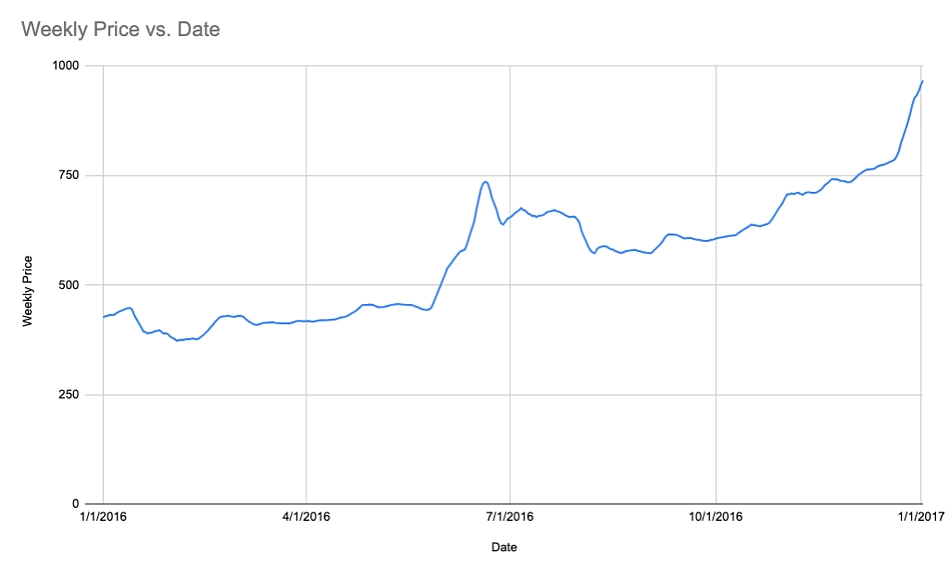
The graphs look progressively more “smoothed” with each higher frequency, which is expected. Nevertheless, on a higher time frame we can note the Bitcoin Halving on July 9, 2016 (07/09/16) and a sustained period of consolidation around this date. If we mark this period, which is equally as prevalent on the weekly time frame, we can notice a period of resistance on the yearly and daily time frame, as shown in the daily time frame below:
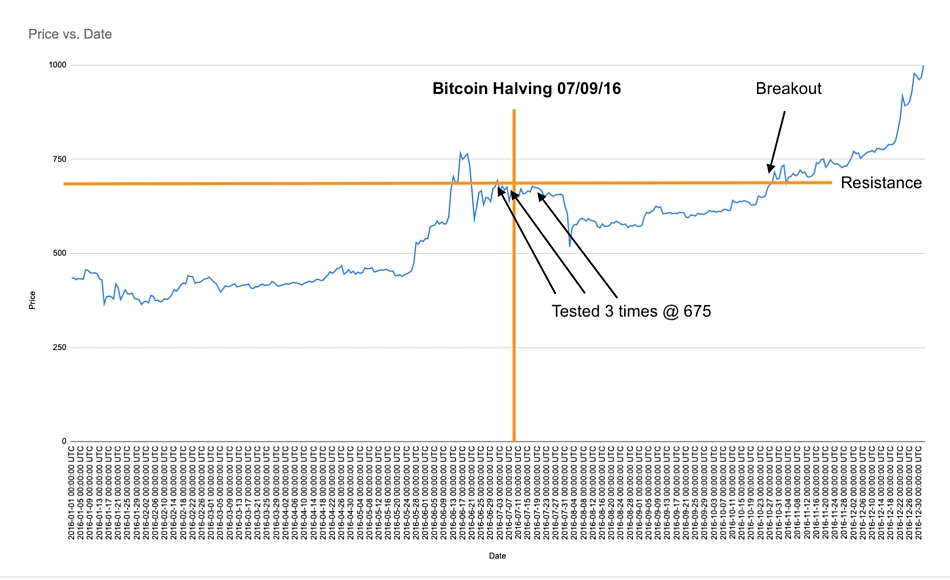
The level 675 is tested on three occasions both before and after the Bitcoin Halving date, as depicted above. As we have marked this on higher time frames as well, we can consult this as a level of resistance. Returning to our Google Sheet, we can notice this price level is not tested again after July 19, 2016 (19/07/2016) until October 26, 2016 (26/10/2016), marking a three and a half-month gap. On a weekly price level it is first tested on July 6, 2016 (06/07/2016) and then again on October 30, 2016 (30/10/2016). Coincidingly, it is tested at a monthly level on July 12, 2016 (12/07/2016) and then not until November 11, 2016 (11/11/2016).
The recurring tests make the level weaker as the supply and demand at that price becomes weaker with each test. Additionally, as this level is availed by a higher time frame as well, we can assume a bigger move was going to ensue. This signals the integral importance of time frames for chart analysis.
We can employ various technical indicators for our technical analysis. For this guide, we will be utilizing the Relative Strength Index (RSI). To fractionise its components, the RSI is calculated as follows:
RSI = 100- [100/(1+RS)]
Where RS = average gain over 14-periods/ average loss over 14-periods
When creating RSI for our data it may look scattered and disorderly, but once we break down its intricacies, it's not as difficult as it may seem. To graph this technical indicator, we are going to make 7 new columns: Price change, Gain, Loss, Average Gain, Average Loss, RS, RSI. The formulas for each are:
- Price Change
=B978-B977 - Gain
=IF(K978>0, K978, 0) - Loss
=IF(K978<0, -K978, 0) - Average Gain
=AVERAGE(L965:L978) - Average Loss
=AVERAGE(M965:M978) - RS = Average Gain/ Average Loss
= N978/O978 - RSI =
100 - ((100 / (1 + P978)))
After these are created, we can plot our RSI indicator. Although appearing untidy and erratic, we can simplify the indicator by plotting three lines, one each at 50, 70 and 30. This is due to the consideration of an asset being overbought when the RSI is greater than 70, oversold when it is less than 30, and the significance of midpoint value crosses.
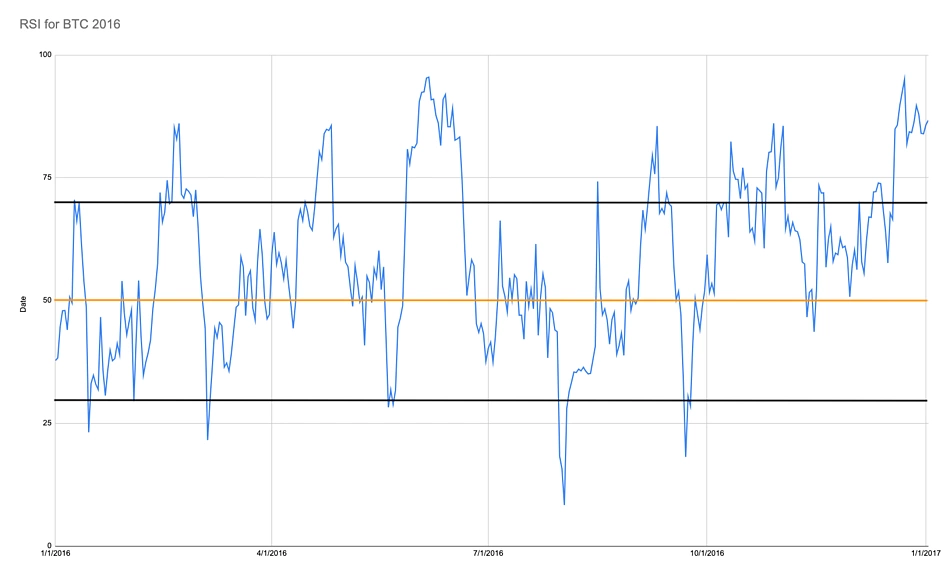
A midpoint value cross can indicate whether there is a bullish or bearish bias in a trend. While judged mostly by perception, the amount of time the RSI spends above the 50 level can be an indication of a bullish bias, and the opposite applies if the bears are in control. This level also serves to indicate if a trend reversal will occur. If we treat the 50 line like a dynamic support/resistance level that switches from one to another when the line is crossed, a trend reversal can occur when the line fails to act as a support/resistance (i.e. crosses).
Similarly, to our earlier analysis (wherein we highlighted a period of consolidation) we can also indicate periods of consolidation when the RSI is chopping through the midpoint continuously, which suggests an expansion is to follow. . This aligns with the graph above, as during the Bitcoin Halving, which we identified in our daily, weekly, and yearly price charts, there is also a period of consolidation in the RSI chart, suggesting an expansion would follow – which it did.
Bitcoin Price Prediction in 2024
Let’s create a price prediction using the previously outlined methods for the Bitcoin Halving slated in April 2024. First, we construct a graph of the BTC price for the past year, using our data on Google Sheets. From the graph, we can observe the two noticeable periods of consolidation that were tested on multiple occasions, before the breakout that occurred (orange arrow), leading to another period of consolidation. To properly formulate an opinion let’s now “zoom in” to the recent period of consolidation.
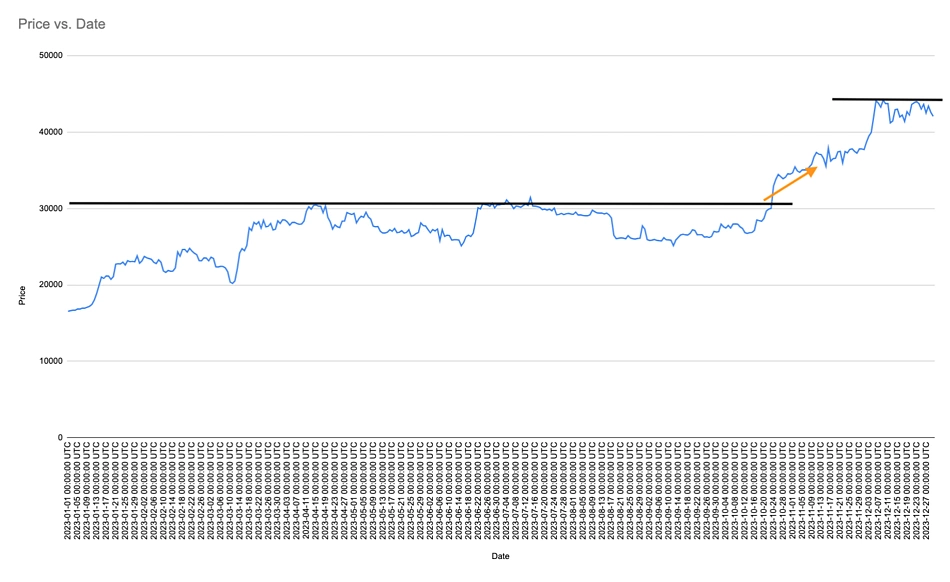
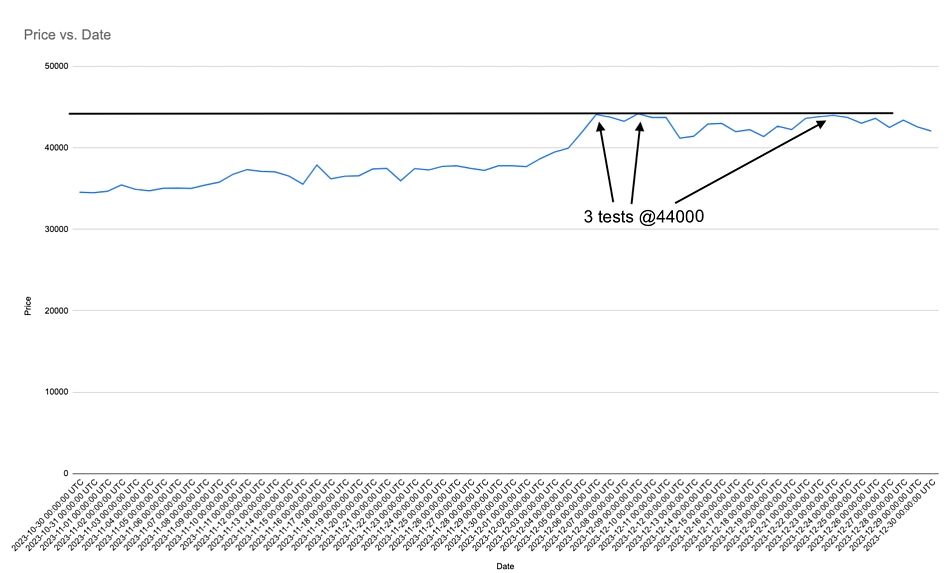
Zooming in on the past 2 months, which includes the period highlighted in the above graph, we can notice 3 tests of the Bitcoin price resistance level at $44,000. Following the last test we have had a sustained period of sideways price movements, as shown below. The recurring tests suggest a weakening resistance level. This bodes well for a breakout after the upcoming halving, but it will also depend on the demand for Bitcoin at the time.
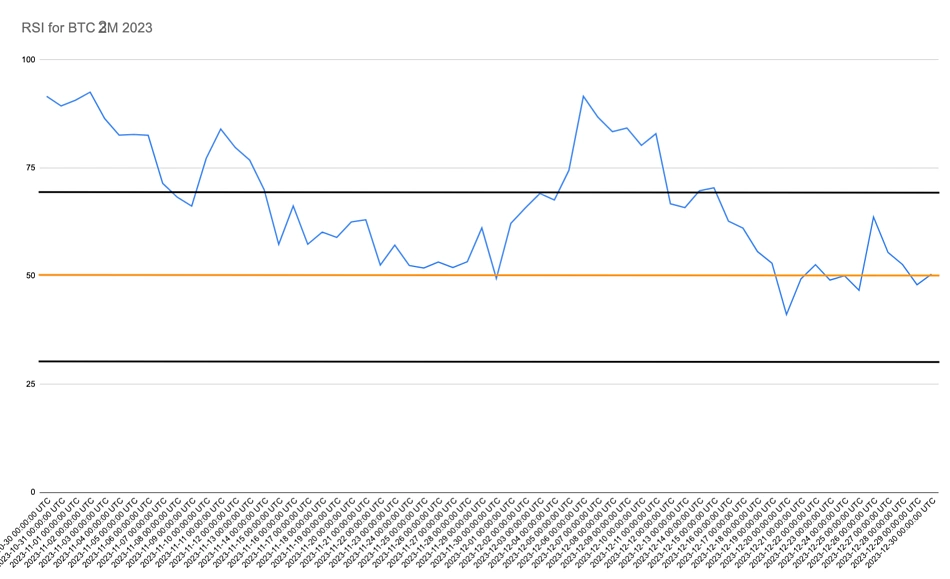
Lastly, we can coincide our price analysis with a check of the RSI for the past 2 months. The recent discernible downwards trend in the RSI from October 12, 2023 (10/12/23) to December 19, 2023 (19/12/23) that carried it below the midpoint value suggests sellers were waking up and long positions were closing. However, the persistence of the RSI above the midpoint for the past 3 months indicates a bearish bias, which may coincide with many being hopeful of a price rally following the upcoming halving. This would align with our previous analysis, spotting a recurring test of $44,000.
Conclusion
Leveraging a crypto data API like CoinGecko API to import historical price data into Google Sheets proves to be valuable and convenient, especially once the initial setup is complete. This method offers a seamless approach to accessing and analyzing market information, allowing for automated data refreshes instead of having to manually export and import crypto data into Google Sheets. This can help to streamline the technical analysis process.

When conducting technical analysis, zoom out! You can always view an obscure technical indicator or chart pattern, assuming it will give you new insight, but the value of establishing confluence on multiple time frames is just as useful, if not more. After creating an overall thesis and understanding what a market is doing then you can zoom in and create a more specialized opinion.
By trimming the original data set to identify trends around past Bitcoin halvings, we are able to construct an investment thesis for the upcoming Bitcoin halving in April 2024, demonstrating a tangible application of the discussed technical analysis techniques. By incorporating these insights and understanding the levels of support and resistance, traders and investors can enhance their ability to make well-informed decisions in the dynamic world of cryptocurrency trading.
Disclaimer: The information provided in this article is for educational and informational purposes only. It does not constitute financial advice, investment recommendations, or endorsement of any specific trading strategy. Readers are encouraged to conduct their own research before making any financial decisions.
Looking for more resources? Learn how to leverage other CoinGecko API endpoints to import live crypto prices into Google Sheets.


 Or check it out in the app stores
 Arbitrum
 Avalanche
 Fantom
 Flare
Flare
 Gnosis
 Linea
Linea
 Optimism
 Polygon
 Polygon zkEVM
 Scroll
 Stellar
 Story
Story
 Syscoin
 Telos
Telos
 Xai
Xai


