





Porteføljer
Legg til ny portefølje

Største Gaming Platform mynter etter markedsverdi
Den globale markedsverdien til Gaming Platform er i dag USD234 Million, en endring på 1.8% de siste 24 timene.
Høydepunkter
$233,581,618
Markedsverdi
1.8%

$20,179,259
24-timers omsetning

🔥 Trender
Ingen trendende mynter tilgjengelig på nå.
| # | Mynt | Kurs | 1t | 24t | 7d | 30d | 24t omsetning | Markedsverdi | FVM | Markedsverdi/FVM | Siste 7 dager | ||
|---|---|---|---|---|---|---|---|---|---|---|---|---|---|
| 303 |

GALA
GALA
|
Kjøp
|
$0.001603 | 0.2% | 1.7% | 4.4% | 30.0% | $12,052,775 | $81,947,032 | $81,947,032 | 0.9999999961950241 |
|
|
| 430 |

Unipoly
UNP
|
$0.1835 | 0.2% | 1.5% | 2.3% | 21.9% | $622,291 | $51,246,250 | $183,527,021 | 0.27922999999999987 |
|
||
| 646 |

DEAPCOIN
DEP
|
$0.001005 | 0.2% | 0.1% | 4.9% | 3.5% | $78,249.95 | $29,996,339 | $29,996,339 | 1.0 |
|
||
| 954 |

GameBuild
GAME
|
$0.0008150 | 0.0% | 1.3% | 2.6% | 15.5% | $137,006 | $15,993,096 | $17,456,307 | 0.9161786692109984 |
|
||
| 1174 |

Portal
PORTAL
|
$0.01232 | 0.0% | 2.4% | 2.0% | 27.4% | $2,816,497 | $10,976,179 | $12,318,283 | 0.891047806163695 |
|
||
| 1290 |

SPACEM WORLD
SPCM
|
$0.0008968 | 0.2% | 1.3% | 7.2% | 9.3% | $213,059 | $9,116,071 | $36,123,640 | 0.25235748031850386 |
|
||
| 1440 |

Nakamoto Games
NAKA
|
$0.07410 | 0.2% | 1.0% | 0.6% | 32.8% | $462,979 | $7,292,215 | $13,337,384 | 0.54675 |
|
||
| 1708 |

CONX
CONX
|
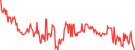
$0.004628 | 1.0% | 3.6% | 1.1% | 15.4% | $193,399 | $4,779,806 | $9,255,463 | 0.5164307869356577 |
|
||
| 1976 |

Altura
ALU
|
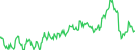
$0.003318 | 0.0% | 0.1% | 1.1% | 35.0% | $2,277,174 | $3,250,701 | $4,379,869 | 0.7421915046949406 |
|
||
| 2317 |

Creo Engine
CREO
|
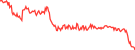
$0.003128 | 0.5% | 10.3% | 21.7% | 36.4% | $128,320 | $2,154,892 | $3,128,079 | 0.6888867089999999 |
|
||
| 2491 |

Ready Cards
READY
|
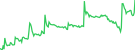
$0.001783 | 1.9% | 0.1% | 3.6% | 66.9% | $51,130.56 | $1,782,908 | $1,782,908 | 1.0 |
|
||
| 2516 |

GAMEE
GMEE
|
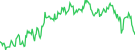
$0.0009744 | 0.3% | 6.9% | 5.0% | 1.8% | $210,715 | $1,724,060 | $3,098,681 | 0.5563852597982579 |
|
||
| 2629 |

YOM
YOM
|
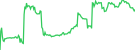
$0.01260 | 0.1% | 2.4% | 1.4% | 27.3% | $508,822 | $1,535,378 | $9,449,370 | 0.16248466914265378 |
|
||
| 2648 |

QORPO WORLD
QORPO
|
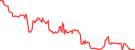
$0.002299 | 0.1% | 6.5% | 11.8% | 42.4% | $61,071.74 | $1,496,165 | $1,723,947 | 0.8678714743862667 |
|
||
| 2672 |

Octokn
OTK
|
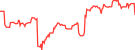
$0.001667 | 0.1% | 1.7% | 9.6% | 66.7% | $39,075.68 | $1,456,133 | $2,000,580 | 0.7278551015519598 |
|
||
| 2894 |

Metacade
MCADE
|
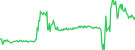
$0.0006184 | 0.0% | 1.9% | 1.8% | 20.0% | $19,908.09 | $1,172,243 | $1,236,731 | 0.9478559806935001 |
|
||
| 2940 |

Myria
MYRIA
|
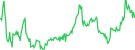
$0.00002305 | 0.8% | 1.7% | 6.2% | 21.6% | $446.59 | $1,116,503 | $1,152,376 | 0.96886984874 |
|
||
| 2949 |

Phantasma Phoenix
SOUL
|
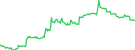
$0.007930 | 1.0% | 8.9% | 7.3% | 32.1% | $17,188.77 | $1,099,095 | $1,099,095 | 1.0 |
|
||
| 2981 |

Tevaera
TEVA
|
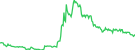
$0.0009003 | 1.5% | 5.1% | 11.5% | 49.3% | $8,893.35 | $1,058,404 | $3,601,106 | 0.2939108903023749 |
|
||
| 3142 |

MimboGameGroup
MGG
|
$0.00004853 | 0.0% | 0.0% | 0.2% | 0.1% | $10,864.41 | $892,912 | $4,673,901 | 0.19104219046055806 |
|
||
| 3608 |

Elympics
ELP
|
$0.0003723 | 0.0% | 0.1% | 0.0% | 0.3% | $12,568.41 | $598,745 | $1,303,118 | 0.45947097612686466 |
|
||
| 3848 |

Vulcan Forged
PYR
|
$0.01599 | 0.5% | 2.9% | 4.9% | 33.8% | $154,357 | $490,971 | $799,664 | 0.6139718897840459 |
|
||
| 3855 |

GAIMIN
GMRX
|
$0.057908 | 0.0% | 1.1% | 7.8% | 16.0% | $1,410.36 | $489,961 | $732,231 | 0.6691334815784955 |
|
||
| 4260 |

Super Champs
CHAMP
|
$0.0003683 | 0.1% | 5.3% | 8.7% | 24.9% | $436.92 | $352,717 | $368,289 | 0.9577188819999999 |
|
||
| 4802 |

Bitcoin Cats
1CAT
|
$0.00004661 | 0.3% | 3.7% | 2.3% | 17.8% | $4.66 | $233,075 | $233,075 | 1.0 |
|
||
| 4971 |

GameSwift
GSWIFT
|
$0.0004393 | 0.1% | 0.5% | 4.0% | 42.1% | $27.82 | $207,296 | $338,685 | 0.6120617180779884 |
|
||
| 5073 |

GAM3S.GG
G3
|
$0.0002963 | 0.0% | 0.7% | 4.3% | 19.7% | $9,020.99 | $196,700 | $296,308 | 0.663834444632851 |
|
||
| 5099 |

Imagine Game Studio
IMAGINE
|
$0.0002046 | 1.1% | 10.9% | 23.1% | 12.3% | $3,173.30 | $193,904 | $193,904 | 1.0 |

|
||
| 5279 |

Hooked Protocol
HOOK
|
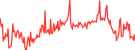
$0.0006048 | 1.4% | 0.2% | 74.9% | 82.3% | $6,058.65 | $174,021 | $302,383 | 0.57549846514 |
|
||
| 5329 |

Bario Entertainment System
BAES
|
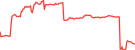
$0.051688 | 8.7% | 5.1% | 7.9% | 22.1% | $3,698.56 | $168,666 | $168,666 | 1.0 |
|
||
| 6173 |

Imaginary Ones
BUBBLE
|
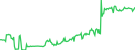
$0.00002484 | 0.1% | 3.8% | 6.7% | 21.6% | $269.83 | $102,208 | $248,400 | 0.41146371610127963 |
|
||
| 6225 |

Pentagon Games
PEN
|
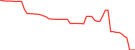
$0.0001240 | 0.0% | 16.9% | 11.5% | 9.7% | $7.57 | $99,201.34 | $124,002 | 0.7999999999999999 |
|
||
| 6380 |

Catheon Gaming
CATHEON
|
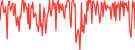
$0.00005726 | 0.0% | 1.7% | 7.4% | 14.3% | $2,508.75 | $91,633.37 | $572,612 | 0.16002694580000001 |
|
||
| 6696 |

PLAY
PLAY
|
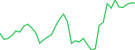
$0.0001047 | 0.0% | 2.0% | 10.2% | 30.0% | $6.38 | $77,868.19 | $104,653 | 0.7440618900531 |
|
||
| 6890 |

HYBUX
HYBUX
|
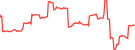
$0.00001607 | 0.0% | 1.8% | 30.8% | 84.7% | $19.70 | $69,952.64 | $160,662 | 0.4354023133729999 |
|
||
| 7217 |

TON Station
MRSOON
|
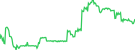
$0.068992 | 0.5% | 6.1% | 5.4% | 31.6% | $104.35 | $59,221.23 | $59,221.23 | 1.0 |
|
||
| 7297 |

Gamestarter
GAME
|
$0.0008059 | 0.0% | 3.1% | 1.6% | 2.4% | $1.77 | $57,213.27 | $80,594.57 | 0.7098899304281 |
|
||
| 7772 |

MXS Games
XSEED
|
$0.051810 | 0.0% | 1.3% | 0.0% | 17.9% | $820.58 | $45,621.26 | $50,847.17 | 0.8972232303834136 |
|
||
| 8059 |

HyperChainX
HPX
|
$0.00004016 | 0.1% | 5.7% | 5.7% | 96.8% | $8.34 | $40,155.03 | $40,155.03 | 1.0 |

|
||
| 8077 |

Playground
PBUX
|
$0.00005067 | 0.6% | 6.6% | 3.3% | 36.7% | $210.34 | $39,900.04 | $50,157.03 | 0.795502340250253 |
|
||
| 8633 |

DEGA
DEGA
|
$0.053222 | 0.0% | 2.8% | 2.8% | 11.5% | $49.24 | $31,501.82 | $85,435.59 | 0.3687201466935255 |
|
||
| 8790 |

GG
GGTK
|
$0.0007154 | 0.0% | 6.8% | 6.8% | 6.8% | $3.58 | $29,546.27 | $33,481.01 | 0.8824786324786325 |
|
||
| 9088 |

PPKAS
PPKAS
|
$0.00001080 | 0.0% | 19.1% | 68.6% | 74.4% | $2,930.44 | $26,408.97 | $26,408.97 | 1.0 |
|
||
| 10544 |

E4C
E4C
|
$0.00005914 | 0.3% | 0.7% | 7.3% | 26.5% | $1.29 | $14,399.52 | $59,137.00 | 0.24349429623200497 |
|
||
| 10679 |

PlayDapp
PDA
|
$0.00002064 | 0.3% | 70.6% | 97.4% | 97.8% | $304.43 | $13,697.74 | $14,448.31 | 0.9480519271428572 |
|
||
| 10983 |

Matr1x
MAX
|
$0.00007165 | 0.0% | 0.5% | 0.5% | 5.3% | $5.53 | $12,337.74 | $57,322.61 | 0.21523333000000003 |

|
||
| 11195 |

Rainmaker Games
RAIN
|
Kjøp
|
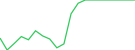
$0.00001403 | 0.0% | 3.9% | 17.0% | 21.0% | $4.24 | $11,522.49 | $14,034.73 | 0.8209979897875229 |
|
|
| 13723 |

ProScrim
PRO
|
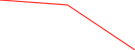
$0.055135 | 0.0% | 0.9% | 4.7% | 84.8% | $3.85 | $4,620.67 | $5,134.20 | 0.8999799043010447 |
|
||
| 15545 |

Spintop
SPIN
|
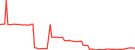
$0.052914 | 0.1% | 0.0% | 7.8% | 11.1% | $1.39 | $2,048.81 | $2,177.56 | 0.9408754077040833 |
|
||

Ethlas
ELS
|
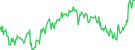
$0.0004884 | 2.1% | 4.4% | 0.4% | 16.9% | $122.06 | - | $170,953 |
|
||||

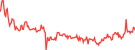
Ultra
UOS
|
$0.001024 | 1.6% | 5.3% | 49.7% | 72.5% | $49,126.63 | - | $1,023,976 |
|
||||

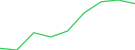
StoryFire
BLAZE
|
$0.051398 | 0.0% | 1.6% | 2.7% | 20.5% | $35.62 | - | $27,951.54 |
|
||||

Lumox Studio
LUMOX
|
$0.00 | - | - | - | - | - | - | - |

|
||||

GGEM
GGEM
|
$0.00 | - | - | - | - | - | - | - |

|
||||

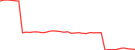
Equilibrium Games
EQ
|
$0.001916 | 0.0% | 28.5% | 28.5% | 28.5% | $0.4393 | - | $191,650 |
|
||||

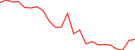
Pancake Games
GCAKE
|
$0.072275 | 0.0% | 2.5% | 4.9% | 11.1% | $28.90 | - | $227,508 |
|
||||

Elixir Games
ELIX
|
$0.0001106 | 0.0% | 3.4% | 17.8% | 18.4% | $1.27 | - | $165,891 |
|
||||

Creta World
CRETA
|
$0.002066 | 0.3% | 6.2% | 8.7% | 23.2% | $84,003.73 | - | $20,660,805 |
|
||||

Pomerium Ecosystem Token
PMG
|
$0.00008286 | 0.0% | 0.1% | 2.3% | 17.8% | $3.34 | - | $82,806.31 |
|
||||

QUDO
QUDO
|
$0.007083 | 0.0% | 1.3% | 3.3% | 20.5% | $40.51 | - | $3,510,311 |

|
||||

Portuma
POR
|
$0.00008881 | 3.6% | 9.4% | 7.5% | 34.1% | $25,233.70 | - | $888,089 |
|
||||

Yooldo
YOOL
|
$0.00 | - | - | - | - | - | - | - |

|
||||

Uncharted
U
|
$0.00 | - | - | - | - | - | - | - |

|
||||

HASHCOW
HCOW
|
$0.00 | - | - | - | - | - | - | - |

|
||||
Viser 1 til 64 av 64 resultater
Rader
Markedsverdi-graf Gaming Platform over ledende mynter
Grafen nedenfor viser markedsverdien og dominansen til store. Gaming Platform inkludert GALA, Unipoly, DEAPCOIN og andre, over en tidsperiode.
Prestasjonsgraf Gaming Platform over ledende mynter
Grafen nedenfor viser den relative ytelsen til ledende Gaming Platform mynter over tid, og sporer prosentvise prisgevinster og tap i forskjellige tidsperioder.




 Eller sjekk ut i App Store


