






Just a Chart Guy
CHARTGUY Price


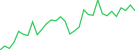
Just a Chart Guy Price Chart (CHARTGUY)
Switch & Compare
| 1h | 24h | 7d | 14d | 30d | 1y |
|---|---|---|---|---|---|
| - | 5.7% | 5.7% | 5.7% | 4.1% | - |
CHARTGUY Converter
Just a Chart Guy Statistics
| Market Cap | $6,157.21 |
|---|---|
| Market Cap / FDV | 1 |
| Fully Diluted Valuation | $6,157.21 |
| 24 Hour Trading Vol | $0.00 |
| Circulating Supply | 941.464M |
| Total Supply | 941.464M |
| Max Supply | 1B |
 Sponsored
Sponsored
CHARTGUY Historical Price
| 24h Range | - – - |
|---|---|
| 7d Range | - – - |
| All-Time High |
$0.0001446
|
| All-Time Low |
$0.054345
|
How do you feel about CHARTGUY today?

Where can you buy Just a Chart Guy?
CHARTGUY tokens have stopped trading - ago on all exchanges listed on CoinGecko. Information will be updated if market activity resumes.
What is the daily trading volume of Just a Chart Guy (CHARTGUY)?
The 24 hour trading volume of Just a Chart Guy (CHARTGUY) is $0 which signals a drop in market activity. If you own CHARTGUY tokens, liquidity of the token is likely to be low. Proceed with caution. You may explore CoinGecko’s list of most traded cryptos for coins with higher liquidity.
What is the highest and lowest price for Just a Chart Guy (CHARTGUY)?
Just a Chart Guy (CHARTGUY) reached an all-time high of $0.0001446 and an all-time low of $0.054345. It’s now trading -95.50% below that peak and 50.50% above its lowest price.
What is the market cap of Just a Chart Guy (CHARTGUY)?
Market capitalization of Just a Chart Guy (CHARTGUY) is $6,157.21 and is ranked #12998 on CoinGecko today. Market cap is measured by multiplying token price with the circulating supply of CHARTGUY tokens (940 Million tokens are tradable on the market today).
What is the fully diluted valuation of Just a Chart Guy (CHARTGUY)?
The fully diluted valuation (FDV) of Just a Chart Guy (CHARTGUY) is $6,157.21. This is a statistical representation of the maximum market cap, assuming the maximum number of 1 Billion CHARTGUY tokens are in circulation today. Depending on how the emission schedule of CHARTGUY tokens are designed, it might take multiple years before FDV is realized.
How does the price performance of Just a Chart Guy compare against its peers?
With a price increase of 0.00% in the last 7 days, Just a Chart Guy (CHARTGUY) is outperforming the global cryptocurrency market which is down -2.60%, while outperforming when compared to similar Meme cryptocurrencies which are down -5.40%.
Just a Chart Guy Markets
You may be interested in these latest crypto news


You may be interested in these crypto articles




Global Just a Chart Guy Prices
Related Coins You May Like




 GeckoAI


 Or check it out in the app stores


