





Portfolios
Add to New Portfolio


Ondo Short-Term U.S. Government Bond Fund
OUSG / ETH
#146
-
0.0%
Price is fetched from contract
0.001376 BTC
2.2%
-
0.0%
$116.76
24h Range
$116.77


Get OUSG Alerts within the CoinGecko app

Convert Ondo Short-Term U.S. Government Bond Fund to Ether (OUSG to ETH)
The price of converting 1 Ondo Short-Term U.S. Government Bond Fund (OUSG) to ETH is - today.
OUSG
ETH
1 OUSG = N/A
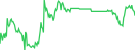
OUSG to ETH Chart
Use log scale
View in full screen
Download as PNG
Download as SVG
Download as JPEG
Download as PDF
View in full screen
Comparison is only available on line charts.
Switch & Compare
Switch & Compare
Need more data?
Explore our API
| 1h | 24h | 7d | 14d | 30d | 1y |
|---|---|---|---|---|---|
| 0.0% | 0.0% | 0.1% | 0.1% | 0.3% | 3.5% |
Ondo Short-Term U.S. Government Bond Fund Statistics
| Market Cap | - |
|---|---|
| Market Cap / FDV | 1 |
| 24 Hour Trading Vol | - |
| Circulating Supply | 2.751M |
| Total Supply | 2.751M |
| Max Supply | ∞ |
Buy / Sell
 Sponsored
Wallet
Sponsored
Earn Crypto
Sponsored
FAQs
-
How much is 1 Ondo Short-Term U.S. Government Bond Fund worth in ETH?
- As of now, the price of 1 Ondo Short-Term U.S. Government Bond Fund (OUSG) in Ether (ETH) is about ETH0.04362.
-
How many OUSG can I buy for ETH1?
- You can buy approximately 22.926681 OUSG for ETH1 today.
-
How do I convert the price of OUSG to ETH?
- Calculate Ondo Short-Term U.S. Government Bond Fund's price in Ether by inputting your desired amount on CoinGecko’s OUSG to ETH converter. Track its historical price movements on the OUSG to ETH chart, and explore more crypto prices in ETH.
-
What is the highest price of OUSG/ETH in history?
- The all-time high price of 1 OUSG in ETH is . It remains to be seen if the value of 1 OUSG/ETH will exceed the current all-time high.
-
What is the price trend of Ondo Short-Term U.S. Government Bond Fund in ETH?
- Over the last month, the price of Ondo Short-Term U.S. Government Bond Fund (OUSG) has gone up by 0.30% against the Ether (ETH). In fact, Ondo Short-Term U.S. Government Bond Fund has underperformed against the broader crypto market, which is up by 10.50%.
7-day price history of Ondo Short-Term U.S. Government Bond Fund (OUSG) to ETH
The daily exchange rate of Ondo Short-Term U.S. Government Bond Fund (OUSG) to ETH fluctuated between a high of ETH0.04359882 on Tuesday and a low of ETH0.04315797 on Thursday in the last 7 days. Within the week, the price of OUSG in ETH had the largest 24-hour price movement on Thursday (1 days ago) by -ETH0.00032869 (0.8%).
Compare the daily prices of Ondo Short-Term U.S. Government Bond Fund (OUSG) in ETH and their 24-hour price movements for the week.
Compare the daily prices of Ondo Short-Term U.S. Government Bond Fund (OUSG) in ETH and their 24-hour price movements for the week.
| Date | Day of the week | 1 OUSG to ETH | 24hr Changes | Change % |
|---|---|---|---|---|
| October 02, 2026 | Friday | N/A | N/A | 0.0% |
| October 01, 2026 | Thursday | ETH0.04315797 | -ETH0.00032869 | 0.8% |
| September 30, 2026 | Wednesday | ETH0.04348666 | -ETH0.00011216 | 0.3% |
| September 29, 2026 | Tuesday | ETH0.04359882 | ETH0.00017577 | 0.4% |
| September 28, 2026 | Monday | ETH0.04342306 | -ETH0.00000393 | 0.0% |
| September 27, 2026 | Sunday | ETH0.04342699 | ETH0.00014216 | 0.3% |































 Or check it out in the app stores


