





Portefeuilles
Ajouter à un nouveau portefeuille

Suivre
![]() en déplacement
Recevez des mises à jour en temps réel via des notifications Push sur l'application.

Ouvrir l'application

xStocks
$98,888M
25.8%
Volume de négociation sur 24 h
🆕
New Listings


xStocks Tokenized Assets
| # | Coin | RWA | Cours | Price Diff vs RWA | 1h % | 24h % | 7D % | 30j % | 24h Volume | Cap. bours. | FDV | Market Cap / FDV | Vol 24h Perps | OI 24h Perps | 7 derniers jours | |
|---|---|---|---|---|---|---|---|---|---|---|---|---|---|---|---|---|
| 1 |
 Nvidia |
$152,22 | 0.3% | 0.1% | 3.2% | 5.6% | 30.0% | $15 602 068 | $112 767 049 | $254 411 581 | 0,44 | $376 678 341 | $10 541 070 |  |
||
| 2 |
 Strategy PP Variable |
$106,37 | 10.3% | 0.3% | 2.3% | 3.4% | 0.3% | $548 526 | $109 784 171 | $315 864 753 | 0,35 | - | - |  |
||
| 3 |
 Circle Internet Group |
$54,52 | 0.7% | 0.7% | 2.0% | 17.2% | 33.5% | $6 605 758 | $100 383 071 | $237 899 184 | 0,42 | $16 281 354 | $2 370 443 |  |
||
| 4 |
 Strategy |
$92,69 | 0.4% | 0.6% | 5.6% | 22.2% | 32.0% | $3 268 533 | $92 203 608 | $185 887 370 | 0,50 | $4 389 754 | $2 741 636 |  |
||
| 5 |
 SpaceX |
$144,99 | 0.0% | 0.0% | 2.2% | 3.8% | 2.2% | $5 109 281 | $82 432 442 | $247 998 846 | 0,33 | - | - |  |
||
| 6 |
 SPDR S&P 500 ETF Trust |
$740,30 | 0.7% | 0.0% | 0.2% | 2.8% | 4.0% | $3 594 700 | $76 050 176 | $207 886 337 | 0,37 | $518 064 | $2 281 397 |  |
||
| 7 |
 Invesco QQQ ETF |
$667,72 | 0.1% | 0.1% | 0.9% | 2.6% | 7.3% | $1 817 910 | $74 577 515 | $214 119 779 | 0,35 | $912 675 | $1 308 752 |  |
||
| 8 |
 Tesla |
$385,77 | 0.3% | 0.1% | 0.9% | 0.3% | 4.9% | $7 155 102 | $68 121 835 | $225 422 241 | 0,30 | $2 330 690 | $1 199 634 |  |
||
| 9 |
 Alphabet Class A |
$287,16 | 0.0% | 0.0% | 1.5% | 3.0% | 17.0% | $3 643 532 | $65 179 632 | $184 036 169 | 0,35 | $93 710 829 | $3 695 994 |  |
||
| 10 |
 Intel |
$55,77 | 0.5% | 0.1% | 0.0% | 8.2% | 39.3% | $305 737 | $27 054 493 | $134 010 027 | 0,20 | $119 839 | $243 587 |  |
||
| 11 |
 SanDisk |
$787,59 | 0.5% | 0.4% | 3.1% | 17.9% | 42.3% | $414 882 | $23 469 261 | $86 472 836 | 0,27 | - | - |  |
||
| 12 |
 iShares $ Treasury Bond 0-1yr UCITS ETF |
$121,80 | 0.7% | - | 0.0% | 0.0% | 0.2% | - | $18 960 097 | $18 960 097 | 1,00 | - | - |  |
||
| 13 |
 Apple |
$355,21 | 0.2% | 0.0% | 1.2% | 0.4% | 3.3% | $3 328 141 | $12 492 055 | $237 163 901 | 0,05 | $1 870 301 | $3 735 413 |  |
||
| 14 |
 SK Hynix - ADR |
$125,94 | 0.9% | 0.7% | 0.3% | 9.8% | 9.1% | $172 897 | $11 877 781 | $76 455 290 | 0,16 | - | - |  |
||
| 15 |
 Coinbase |
$113,11 | 0.3% | 0.4% | 2.9% | 15.5% | 32.9% | $5 234 726 | $11 235 663 | $104 342 972 | 0,11 | $37 448 287 | $7 612 521 |  |
||
| 16 |
 SPDR Gold Shares |
$341,87 | 0.5% | 0.1% | 2.0% | 6.5% | 10.3% | $2 114 533 | $10 130 876 | $121 571 457 | 0,08 | $81 724,63 | $677 514 |  |
||
| 17 |
 Amazon |
$270,20 | 0.5% | 0.0% | 4.4% | 1.6% | 2.4% | $4 301 748 | $9 975 797 | $150 282 318 | 0,07 | $16 965 917 | $1 279 776 |  |
||
| 18 |
 Meta Platforms |
$620,57 | 0.1% | 0.3% | 0.2% | 1.5% | 12.6% | $2 136 138 | $9 936 553 | $138 331 123 | 0,07 | $15 457 175 | $7 939 453 |  |
||
| 19 |
SPDR S&P 500 ETF Trust
|
$741,03 | 0.8% | 0.0% | 0.1% | 3.0% | 4.0% | $2 385 399 | $8 326 248 | $8 326 248 | 1,00 | - | - | 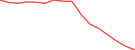 |
||
| 20 |
 Robinhood Markets |
$71,11 | 0.3% | 0.2% | 1.5% | 15.0% | 26.4% | $9 913 275 | $8 144 087 | $148 067 814 | 0,06 | $4 735 331 | $541 060 |  |
||
| 21 |
 Microsoft |
$514,93 | 0.1% | 0.2% | 1.2% | 1.8% | 3.8% | $631 369 | $7 764 609 | $155 379 759 | 0,05 | - | - |  |
||
| 22 |
 Advanced Micro Devices |
$536,25 | 0.1% | 0.5% | 4.8% | 4.8% | 0.1% | $429 978 | $7 486 817 | $199 081 769 | 0,04 | - | - |  |
||
| 23 |
 Broadcom |
$358,38 | 0.3% | 0.0% | 2.6% | 1.3% | 6.5% | $725 604 | $6 996 123 | $103 372 847 | 0,07 | $10 795 210 | $68 859,42 |  |
||
| 24 |
 ProShares UltraPro QQQ |
$54,38 | 0.4% | 0.0% | 1.7% | 7.8% | 23.2% | $1 961,43 | $6 398 693 | $135 673 643 | 0,05 | $17 290 693 | $11 266 832 |  |
||
| 25 |
Invesco QQQ ETF
|
$668,75 | 0.1% | 0.0% | 1.0% | 2.6% | 7.2% | $4 115 545 | $5 735 715 | $5 735 715 | 1,00 | - | - | 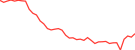 |
||
| 26 |
 Marvell Technology |
$147,22 | 0.6% | 0.0% | 2.0% | 10.0% | 36.9% | $20 823,87 | $5 563 580 | $164 763 225 | 0,03 | - | - |  |
||
| 27 |
 Taiwan Semiconductor Manufacturing - ADR |
$363,29 | 1.1% | 0.0% | 2.7% | 11.5% | 14.3% | $10 976,74 | $5 128 493 | $96 272 267 | 0,05 | - | - |  |
||
| 28 |
 Oracle |
$116,52 | 1.1% | 0.1% | 2.0% | 7.0% | 9.8% | $1 654,03 | $4 403 667 | $74 367 074 | 0,06 | $7 263,70 | $536 810 |  |
||
| 29 |
 BitMine Immersion Technologies |
$15,80 | 0.0% | 0.0% | 1.0% | 17.3% | 27.2% | $1 323,27 | $3 655 125 | $67 886 299 | 0,05 | - | - |  |
||
| 30 |
 KRAQ |
$41,43 | 312.6% | - | 306.5% | 306.5% | 315.1% | - | $2 698 373 | $309 682 403 | 0,01 | - | - |  |
||
| 31 |
 Palantir Technologies |
$158,46 | 0.8% | 0.6% | 0.7% | 7.0% | 18.2% | $81 893,00 | $2 655 274 | $163 461 380 | 0,02 | $18 736,27 | $8 327,11 |  |
||
| 32 |
Nvidia
|
$152,38 | 0.4% | 0.2% | 3.2% | 5.7% | 30.0% | $5 118 669 | $2 651 960 | $2 651 960 | 1,00 | - | - |  |
||
| 33 |
 iShares $ Treasury Bond 1-3yr UCITS ETF |
$5,95 | 0.6% | - | 0.1% | 0.3% | 0.5% | - | $2 463 937 | $2 463 937 | 1,00 | - | - |  |
||
| 34 |
SpaceX
|
$144,98 | 0.0% | 0.1% | 2.1% | 3.9% | 2.2% | $1 936 865 | $2 334 569 | $2 334 569 | 1,00 | - | - |  |
||
| 35 |
 McDonald's |
$275,99 | 1.0% | 0.0% | 1.0% | 0.7% | 12.5% | $1 213 477 | $2 309 461 | $92 818 695 | 0,02 | $819 042 | $766 752 |  |
||
| 36 |
 Netflix |
$60,28 | 0.2% | 0.4% | 1.0% | 6.1% | 13.6% | $35 145,18 | $2 238 815 | $213 756 611 | 0,01 | - | - |  |
||
| 37 |
 Berkshire Hathaway |
$573,68 | 0.1% | 0.0% | 1.9% | 2.3% | 7.9% | $34 860,06 | $2 226 674 | $114 017 713 | 0,02 | - | - |  |
||
| 38 |
 GameStop |
$26,63 | 0.8% | 0.1% | 5.0% | 5.8% | 1.1% | $171 340 | $2 182 276 | $131 270 627 | 0,02 | - | - |  |
||
| 39 |
Tesla
|
$385,44 | 0.4% | 0.1% | 0.7% | 0.5% | 4.8% | $1 502 581 | $1 908 465 | $1 908 465 | 1,00 | - | - |  |
||
| 40 |
 Vanguard Total Stock Market ETF |
$364,67 | 0.8% | 0.0% | 1.2% | 3.6% | 3.9% | $14 380,02 | $1 792 328 | $132 255 551 | 0,01 | - | - |  |
||
| 41 |
 MARA Holdings |
$6,49 | 2.5% | 0.0% | 0.6% | 15.9% | 14.7% | $36,72 | $1 550 072 | $78 152 794 | 0,02 | - | - |  |
||
| 42 |
 iShares Silver Trust |
$41,28 | 0.1% | 0.0% | 1.7% | 11.1% | 20.8% | $9 098,69 | $1 366 145 | $59 999 565 | 0,02 | - | - |  |
||
| 43 |
 Eli Lilly |
$1 379,78 | 0.0% | 0.0% | 2.4% | 4.1% | 11.0% | $14 960,86 | $1 289 807 | $159 093 454 | 0,01 | - | - |  |
||
| 44 |
 Coca-Cola |
$99,59 | 1.8% | 0.1% | 0.9% | 0.6% | 5.2% | $41 311,89 | $1 166 682 | $145 391 705 | 0,01 | $272 167 | $16 342,22 |  |
||
| 45 |
 ASML Holding NV |
$1 375,88 | 2.8% | 0.0% | 2.0% | 9.1% | 16.8% | $457,27 | $1 162 204 | $106 811 944 | 0,01 | - | - |  |
||
| 46 |
 AppLovin |
$384,96 | 2.0% | 0.0% | 0.1% | 1.5% | 47.4% | $955,38 | $1 032 974 | $109 835 092 | 0,01 | - | - |  |
||
| 47 |
 IBM |
$224,62 | 2.1% | 2.1% | 3.0% | 9.3% | 5.3% | $1 220,75 | $990 912 | $81 726 897 | 0,01 | - | - |  |
||
| 48 |
 Invesco Short Term Treasury ETF |
$106,16 | 0.3% | 0.0% | 0.5% | 0.6% | 1.8% | $299,30 | $888 377 | $627 708 059 | 0,00 | - | - |  |
||
| 49 |
Circle Internet Group
|
$54,56 | 0.8% | 0.6% | 2.1% | 17.3% | 33.6% | $741 436 | $888 013 | $888 013 | 1,00 | - | - |  |
||
| 50 |
 CrowdStrike |
$249,23 | 0.8% | 1.1% | 15.8% | 7.5% | 8.7% | $637,65 | $883 486 | $231 415 893 | 0,00 | - | - |  |
||
| 51 |
 VanEck Semiconductor ETF |
$465,44 | 0.4% | 0.0% | 0.3% | 6.5% | - | $513 246 | $825 790 | $825 790 | 1,00 | - | - | 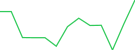 |
||
| 52 |
 Chevron |
$211,61 | 2.8% | 0.4% | 2.1% | 0.8% | 6.0% | $547,73 | $791 744 | $129 114 613 | 0,01 | - | - |  |
||
| 53 |
SK Hynix - ADR
|
$126,11 | 1.1% | 0.3% | 0.3% | 9.8% | 9.2% | $868 346 | $781 342 | $781 342 | 1,00 | - | - |  |
||
| 54 |
 Micron Technology |
$721,23 | 0.6% | 0.1% | 0.9% | 9.1% | - | $1 029 641 | $731 828 | $731 828 | 1,00 | - | - | 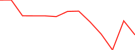 |
||
| 55 |
 Exxon Mobil |
$164,32 | 1.9% | 0.0% | 3.9% | 1.5% | 9.7% | $944,41 | $649 615 | $128 397 682 | 0,01 | - | - |  |
||
| 56 |
 iShares Russell 2000 ETF |
$268,71 | 1.0% | - | 3.1% | 3.9% | 1.5% | - | $638 408 | $101 109 267 | 0,01 | - | - |  |
||
| 57 |
 DeFi Development Corp. |
$2,71 | 0.4% | 1.4% | 5.7% | 15.8% | 26.7% | $4 383,66 | $618 622 | $618 622 | 1,00 | $49 387,19 | $135 367 |  |
||
| 58 |
 Johnson & Johnson |
$267,34 | 1.9% | 0.0% | 5.1% | 5.0% | 5.3% | $742,24 | $595 666 | $109 222 442 | 0,01 | - | - |  |
||
| 59 |
Alphabet Class A
|
$287,42 | 0.1% | 0.2% | 1.3% | 3.0% | 17.0% | $387 721 | $594 873 | $594 873 | 1,00 | - | - |  |
||
| 60 |
 Vanguard Total World |
$151,13 | 0.4% | 0.0% | 2.9% | 1.2% | 5.0% | $105,79 | $582 279 | $113 111 090 | 0,01 | - | - |  |
||
| 61 |
 Cisco Systems |
$97,34 | 0.5% | 0.6% | 2.1% | 2.3% | 8.2% | $21 436,60 | $566 559 | $110 961 062 | 0,01 | - | - |  |
||
| 62 |
Apple
|
$355,56 | 0.3% | 0.1% | 1.2% | 0.3% | 3.4% | $213 631 | $557 444 | $557 444 | 1,00 | - | - |  |
||
| 63 |
 UnitedHealth |
$349,70 | 0.4% | 0.1% | 10.3% | 12.3% | 14.0% | $38 362,19 | $534 561 | $134 857 225 | 0,00 | - | - |  |
||
| 64 |
 Novo Nordisk |
$40,20 | 1.6% | 0.0% | 3.3% | 3.1% | 0.7% | $286,84 | $533 999 | $86 331 144 | 0,01 | - | - |  |
||
| 65 |
 JPMorgan Chase |
$321,46 | 1.3% | 0.0% | 5.0% | 6.8% | 7.1% | $4 799,94 | $528 811 | $98 376 337 | 0,01 | - | - |  |
||
| 66 |
 State Street Energy Select Sector SPDR Fund |
$62,09 | 1.3% | 0.0% | 3.1% | 1.6% | 9.2% | $29,49 | $518 392 | $76 316 316 | 0,01 | - | - |  |
||
| 67 |
 Jersey Mike's Subs |
$19,84 | 6.0% | - | 17.9% | 17.9% | 20.3% | - | $502 721 | $502 721 | 1,00 | - | - |  |
||
| 68 |
 Salesforce |
$192,04 | 0.4% | 0.0% | 3.0% | 11.4% | 20.9% | $1 701,26 | $494 202 | $97 688 757 | 0,01 | - | - |  |
||
| 69 |
 Moderna |
$204,18 | 4.3% | 0.0% | 2.5% | 18.9% | 9.9% | $624,80 | $445 261 | $185 824 705 | 0,00 | - | - |  |
||
| 70 |
 Goldman Sachs |
$888,10 | 0.9% | 0.0% | 3.0% | 4.5% | 1.1% | $927,35 | $424 177 | $112 142 328 | 0,00 | - | - |  |
||
| 71 |
 Visa |
$406,24 | 2.2% | 0.0% | 0.7% | 4.3% | 0.3% | $1 146,43 | $405 979 | $124 837 709 | 0,00 | - | - |  |
||
| 72 |
 Procter & Gamble |
$169,53 | 0.3% | 0.0% | 0.7% | 1.7% | 7.6% | $14 253,28 | $361 141 | $119 338 905 | 0,00 | - | - |  |
||
| 73 |
 Pfizer |
$29,31 | 4.6% | 0.2% | 0.7% | 4.3% | 0.3% | $352 660 | $360 674 | $132 021 903 | 0,00 | - | - |  |
||
| 74 |
 Fundrise Innovation Fund |
$21,29 | 3.4% | 0.0% | 12.0% | 11.9% | 182.0% | $36 730,64 | $343 673 | $58 359 648 | 0,01 | - | - |  |
||
| 75 |
 Amber |
$1,59 | 8.5% | 0.0% | 2.6% | 10.2% | 14.5% | $1 246,19 | $341 451 | $95 269 995 | 0,00 | - | - |  |
||
| 76 |
 TON |
$2,80 | 2.1% | 0.0% | 6.1% | 0.7% | 1.5% | $606,45 | $331 030 | $103 543 487 | 0,00 | - | - |  |
||
| 77 |
 PepsiCo |
$142,01 | 0.2% | 0.2% | 1.3% | 0.6% | 6.0% | $16 643,14 | $326 249 | $102 543 076 | 0,00 | - | - |  |
||
| 78 |
 AbbVie |
$287,09 | 0.6% | 0.0% | 1.7% | 1.8% | 0.4% | $17 594,80 | $324 533 | $124 802 169 | 0,00 | - | - |  |
||
| 79 |
 Global X Copper Miners ETF |
$61,16 | 1.0% | 0.0% | 6.1% | 18.3% | 24.6% | $2 012,87 | $302 833 | $67 814 504 | 0,00 | - | - |  |
||
| 80 |
Strategy
|
$92,81 | 0.5% | 0.8% | 5.6% | 22.2% | 32.0% | $411 935 | $258 342 | $258 342 | 1,00 | - | - |  |
||
| 81 |
 Uber |
$69,13 | 0.1% | 0.0% | 2.2% | 5.5% | 0.2% | $32,35 | $251 488 | $101 703 461 | 0,00 | - | - |  |
||
| 82 |
Microsoft
|
$514,60 | 0.0% | 0.1% | 1.0% | 1.7% | 4.2% | $257 379 | $249 011 | $249 011 | 1,00 | - | - |  |
||
| 83 |
 Bank of America |
$49,33 | 0.5% | 1.5% | 4.0% | 0.8% | 2.0% | $54,99 | $245 288 | $98 235 598 | 0,00 | - | - |  |
||
| 84 |
 iShares Core MSCI Emerging Markets ETF |
$70,56 | 0.1% | 0.0% | 2.0% | 7.1% | 9.3% | $330,21 | $244 955 | $244 955 | 1,00 | - | - |  |
||
| 85 |
Meta Platforms
|
$621,81 | 0.1% | 0.1% | 0.1% | 1.5% | 12.5% | $294 875 | $231 264 | $231 264 | 1,00 | - | - |  |
||
| 86 |
 PayPal |
$58,06 | 0.3% | 0.0% | 1.4% | 1.0% | 2.8% | $520,41 | $228 336 | $103 509 991 | 0,00 | - | - |  |
||
| 87 |
 abrdn Physical Platinum Shares ETF |
$12,34 | 1.4% | 0.0% | 3.1% | 13.0% | 18.0% | $634,45 | $227 539 | $64 648 723 | 0,00 | - | - |  |
||
| 88 |
 Walmart |
$127,90 | 0.3% | 0.0% | 1.6% | 0.2% | 6.5% | $97,50 | $227 011 | $129 166 686 | 0,00 | - | - |  |
||
| 89 |
 Pop Mart International |
$18,01 | 2.0% | 0.2% | 1.3% | 1.5% | 2.9% | $22 862,45 | $220 977 | $220 977 | 1,00 | - | - |  |
||
| 90 |
 Comcast |
$25,46 | 0.5% | 0.2% | 0.3% | 2.5% | 15.5% | $7 345,92 | $212 620 | $96 176 901 | 0,00 | - | - |  |
||
| 91 |
 Oklo |
$23,40 | 5.7% | - | 0.6% | 12.8% | 28.7% | - | $211 537 | $67 906 045 | 0,00 | - | - |  |
||
| 92 |
 Schwab International Equity ETF |
$26,00 | 0.0% | 0.0% | 1.9% | 4.7% | 3.5% | - | $204 475 | $204 475 | 1,00 | - | - |  |
||
| 93 |
 Global X Uranium ETF |
$30,52 | 3.0% | - | 23.5% | 23.2% | 39.0% | - | $200 669 | $36 216 502 | 0,01 | - | - |  |
||
| 94 |
 Constellation Energy |
$261,08 | 1.5% | 0.0% | 7.1% | 5.2% | 1.3% | $5,34 | $193 095 | $64 328 425 | 0,00 | - | - |  |
||
| 95 |
 Tencent - ADR |
$44,83 | 5.2% | 1.7% | 4.6% | 11.9% | 13.1% | $29 958,45 | $193 020 | $193 020 | 1,00 | - | - |  |
||
| 96 |
 Merck |
$139,68 | 1.3% | 0.0% | 3.0% | 4.0% | 3.2% | $11,89 | $189 569 | $135 837 496 | 0,00 | - | - |  |
||
| 97 |
 Riot Platforms |
$17,95 | 3.2% | 0.0% | 2.7% | 2.7% | 25.7% | $539,80 | $187 300 | $113 620 336 | 0,00 | - | - |  |
||
| 98 |
 Vida Global |
$0,6493 | 9.1% | 0.6% | 1.1% | 13.7% | 40.2% | $4 656,15 | $177 502 | $61 344 224 | 0,00 | - | - |  |
||
| 99 |
 Danaher |
$225,72 | 1.3% | 0.0% | 0.8% | 3.6% | 1.3% | $7 232,21 | $170 373 | $100 164 947 | 0,00 | - | - |  |
||
| 100 |
 Accenture |
$229,37 | 0.1% | 0.0% | 4.1% | 9.1% | 3.1% | $25 489,95 | $168 031 | $106 402 948 | 0,00 | - | - |  |


About xStocks
Are you the issuer? Submit a request to keep your details up to date.
Issuance
Identity
Issuing Entity
Backed Assets (JE) Limited
The legal company that issues this token. This may differ from the brand name.
Domicile
🇯🇪 Jersey
The country where it's registered.
Issuance Framework
Where and under which rules this product is offered. Some products involve several countries' laws.
🇱🇮 Liechtenstein · FMA · EU Prospectus Regulation base prospectus, passported across the EEA
🇯🇪 Jersey · JFSC · Jersey issuer consents
🇺🇸 United States · none · not registered
Structure
Tokenization Model
What the token legally is: the real asset, an interest in an asset held for you, or the issuer's own contract that tracks the price.
Third-Party Synthetic
The token is the issuer's own note or derivative that tracks the price. No real asset is held for you.
Legal Instrument
The legal form of what you hold: a share, fund unit, note, derivative, or claim on physical commodity.
Debt Security
A note owed to you by the token issuer. You're effectively a lender, with returns tied to the asset's price.
Claim Against
Who your claim points to: the real asset's issuer, a fund, the physical commodity itself, or the company that issued the token.
RWA Token Issuer
You're a creditor or counterparty of the company that issued the token, not an owner of the asset.
Backing Type
What stands behind your token: assets held specifically for you, a shared pool, pledged collateral, or only the issuer's promise.
Collateralized
Assets are pledged to holders, enforced by a security agent if needed. Recovery is capped at the collateral.
Holder Rights
Voting
Whether you can vote at shareholder or fund meetings, and how.
None
No voting rights.
Dividend
Whether and how you receive dividends or income from the underlying asset.
Reinvested Rebase
Payouts are reinvested automatically. Your token balance or value grows instead of you receiving cash.
Corporate Actions
How events like stock splits or mergers affect your holding.
Rebase
Your holding is adjusted to reflect events like splits, but you don't take part as a shareholder.
Pre-emptive Subscription Rights
Whether you get first right to buy new shares when the company issues more.
None
You don't get first right to buy new shares.
Information Disclosure Rights
What information you're legally entitled to receive, and from whom.
Via Platform, No Inspection Rights
The platform publishes data like NAV or proof-of-reserves. You have no legal right to inspect the issuer's books.
Enforcement / Legal Rights
Who you can take legal action against to enforce your rights.
Against Issuing Entity or SPV
You can pursue the token issuer, fund or special-purpose company, but your reach stops there.
Residual Liquidation Claim
What you'd be entitled to if the issuer went bankrupt, and how you'd rank against other creditors.
Secured Creditor on Collateral
You have a claim on specific pledged collateral if the issuer fails. Recovery is capped at what it sells for.
Access
Redemption
Whether you can return the token to the issuer, what you'd get back (cash or the real asset), and whether ID checks apply.
Cash Only
You can redeem the token with the issuer for cash.
Redemption KYC Required
Yes
Whether you must verify your identity before redeeming with the issuer.
Open to US Persons
No
Whether US persons are allowed to hold or buy this product.
KYC Required
No
Whether you must verify your identity to hold or buy this product.
Sophisticated Investors Only
No
Whether only professional, accredited or qualified investors can hold this product.
Transferability
Whether you can send this token to other wallets freely, only to approved wallets, or not at all.
Open
Freely transferable on-chain. Sanctions screening or issuer freezes may still apply.
Source
Evidence
assets.backed.fi
Info based on issuer documents listed above. Refer to the source for full terms.
xStocks Statistics
24h Volume by Token
24h Perps Volume by Token
Volume
Trading volume of xStocks's tokens over time.
Perps Volume
Perps trading volume of xStocks's tokens over time.


 Ou consultez l'application dans les magasins d'applications


