
Key Takeaways
-
A swing failure pattern is a technical indicator used in trading to signal a trend reversal.
-
It takes place on uptrends and downtrends, signaling sell and buy respectively by allowing investors to detect weakness in an existing trend and early reversal signals.
-
A bullish swing failure pattern is primarily observed in an uptrend and is characterized by a failed attempt to make a higher high, followed by a break below the most recent swing low.
-
A bearish swing failure pattern is typical in a downtrend and is characterized by a failed attempt to make a lower low, followed by a break above the most recent swing high.
-
Swing failure patterns are not always reliable and should be used with other technical analysis tools and indicators to make informed investment decisions.

The Swing Failure Pattern (SFP) is an important technical indicator commonly seen in overbought and oversold zones. It is a pattern used in technical analysis, which aims to project price movement using historical asset price and volume data. Technical analysis is best used alongside fundamental analysis, which offers a broad picture of the market, drawing on financials, user base, geo-political activities, and real-world utility to predict future crypto price movement.
This guide defines a swing failure pattern in crypto trading, what it looks like, the best time frame for swing failure pattern trading, bullish swing failure patterns, and bearish swing failure patterns.
What is the Swing Failure Pattern in Trading?
The Swing Failure Pattern (SFP) is used in technical analysis by traders to identify potential trend reversals. It indicates when the prevailing market trend weakens, and another trend emerges. SFPs are found in bullish and bearish markets and are often used by swing traders, who aim to capitalize on short-term price movements.
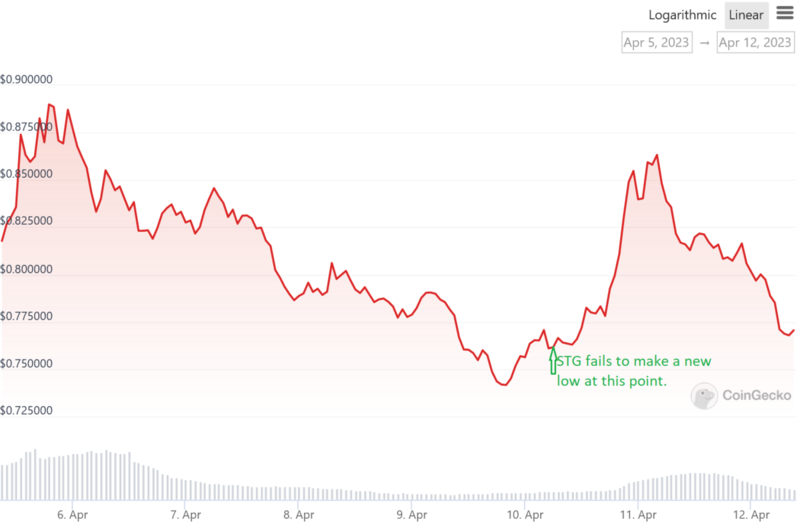
SFP typically occurs when the price of an asset fails to make a new high or low, despite a strong move in the opposite direction. For example, in a bullish market, the price may make a new high but fail to make another high on the next swing, despite a strong move in the opposite direction. This failure to continue the upward trend is seen as a signal that the trend may be reversing.

In the image above, the asset fails to make a new high, leading to a trend reversal.

In the image above, the asset fails to make a new low, leading to a trend reversal.
After identifying an SFP, you can take a position opposite to the prevailing trend. For example, in a bullish market, you may short once you identify an SFP, expecting the market to reverse and move lower. Similarly, you can buy in a bearish market once you spot the pattern, expecting the market to change and move higher.
The swing failure pattern is important because it can help you to identify potential trend reversals and capitalize on short-term price movements. By identifying the patterns, you can enter and exit trades at the optimal time, maximizing your profits and minimizing losses.
However, it is important to note that, like all technical analysis tools and indicators, the SFP is not foolproof. Cryptocurrencies are quite unpredictable, and trends can reverse unexpectedly. Therefore, you should always use proper risk management techniques, such as setting stop-loss orders, to limit losses if the market moves against your plan.
How to Identify a Swing Failure Pattern
Identifying an SFP is helpful, especially when you are looking to capitalize on short-term price movements and potential trend reversals. Follow the steps below to spot a Swing Failure Pattern:
1. Identify the Prevailing Trend
The first step in identifying a swing failure pattern is determining the prevailing trend – is it an uptrend or downtrend? You can accurately identify a prevailing trend with the help of technical analysis tools, such as moving averages, trend lines, or chart patterns.

2. Look for a Strong Move in the Opposite Direction
After identifying the current trend, you should look for a strong move in the opposite direction. This move should be significant enough to indicate a potential trend reversal.

3. Watch for a Failure to Make a New High or Low
After spotting a solid move in the opposite direction, you should watch for a failure to make a new high or low. This failure indicates that the market may be losing momentum and that a reversal could occur.
4. Confirm the Pattern with other Indicators
You can use other technical analysis tools, such as momentum indicators, volume indicators, or candlestick patterns, to confirm the formation of an SFP.
5. Act
After confirming the formation of an SFP, you can act by entering a position in the opposite direction of the prevailing trend. For example, if the prevailing trend is bullish, you should short your trade in anticipation of a trend reversal.
Generally, identifying an SFP requires combining technical analysis tools and careful observation of price movements. Following the steps outlined above, you can spot potential trend reversals and capitalize on short-term price movements.
What Time Frame is Best for Swing Failure Pattern Trading?
The best time frame for swing failure pattern trading depends on your style and preferences. Some traders prefer shorter time frames, such as 5-15-minute charts, while others prefer longer ones, such as daily or weekly charts.
Generally, swing trading involves holding positions for several days to weeks, making it more suitable for longer time frames. Therefore, daily or weekly charts might be ideal for identifying potential trend reversals.
However, you can also use shorter time frames for SFP trading, especially if you prefer a more active trading style. In this case, you can use 1-hour or 4-hour charts to identify swing failure patterns and take advantage of short-term price movements.
Ultimately, the best time frame for SFP trading depends on your strategy, risk tolerance, and preferred trading style. Moreover, regardless of your time frame, you should always leverage proper risk management techniques, such as setting stop-loss orders, to limit losses if the market moves against you.
Bullish Swing Failure Patterns
Bullish swing failure patterns are chart patterns often used in technical analysis to identify potential changes in the trend of an asset in trading. They are typically observed in uptrends and are characterized by failed attempts to make higher highs, followed by breaks below the most recent swing lows.

The bullish swing failure patterns are regarded as a sign of weakness in an uptrend, indicating that the bulls are losing momentum and the bears are gaining strength. These patterns are also known as "bull traps" because they can lure unsuspecting investors into buying, only to be trapped in a losing trade when the trend reverses.
You should typically look for two key components to identify a bullish swing failure pattern. The first component is a clear uptrend with a series of higher highs and higher lows. The second component is a failed attempt to make a higher high, followed by a break below the most recent swing low.
After identifying these components, you may look for other signs of weakness in the uptrend, such as a bearish divergence in the momentum indicators or a pattern of lower highs and lower lows in the price action. These additional signals will help confirm the potential trend reversal and offer more confidence in shorting an asset.
It's important to note that bullish swing failure patterns are not always reliable and should be used with other technical analysis tools and indicators. You should also be aware of the potential risks of trading against a strong uptrend and apply appropriate risk management techniques, such as setting stop-loss orders and managing position size to avoid missing profitable opportunities.
Bearish Swing Failure Patterns
Like bullish swing failure patterns, bearish swing failure patterns are chart patterns commonly used in technical analysis to spot potential changes in the trend of an asset. They are often observed in downtrends and are characterized by failed attempts to make lower lows, followed by breaks above the most recent swing highs.

Most traders see bearish swing failure patterns as signs of weakness in downtrends, indicating that the bears are losing momentum and the bulls are gaining strength. These patterns are also known as "bear traps" because they can lure unsuspecting investors into selling, only to be trapped in a losing trade when the trend reverses.
You should look for two key elements to identify a bearish swing failure pattern. The first one is a clear downtrend with a series of lower lows and lower highs. The second component is a failed attempt to make a lower low, followed by a break above the most recent swing high.
After confirming both elements, you should look for other signs of weakness in the downtrend, such as a bullish divergence in the momentum indicators or a pattern of higher highs and higher lows in the price action. These additional signals will help confirm the potential trend reversal and clarify your decision to long for an asset.
Conclusion
Swing Failure Pattern is a technical analysis tool used in trading to identify potential trend reversals. It indicates when the prevailing market trend weakens, and another trend emerges. While this pattern is not 100% foolproof, it's a simple and effective technical indicator for identifying trend reversals. By understanding and leveraging, you'll be able to identify potential trend reversals and take the necessary steps,


 Or check it out in the app stores

