





Portföljer
Lägg till i ny portfölj


xStocks
$104,889M
4.6%
24 h handelsvolym
🆕
New Listings


xStocks Tokenized Assets
| # | Coin | RWA | Pris | Price Diff vs RWA | 1h % | 24h % | 7d % | 30d % | 24h Volume | Börsvärde | FDV | Market Cap / FDV | Eviga 24h-vol | Eviga 24h-OI | Senaste 7 dagarna | |
|---|---|---|---|---|---|---|---|---|---|---|---|---|---|---|---|---|
| 1 |
 Strategy PP Variable |
$108,36 | 9.8% | 0.6% | 0.7% | 1.0% | 3.6% | $604 008 | $120 753 319 | $321 591 647 | 0,38 | - | - |  |
||
| 2 |
 Nvidia |
$155,73 | 0.1% | 1.2% | 1.1% | 7.5% | 26.9% | $17 059 001 | $109 347 767 | $252 182 381 | 0,43 | $464 710 722 | $15 728 256 |  |
||
| 3 |
 Circle Internet Group |
$54,94 | 0.1% | 0.2% | 5.7% | 14.9% | 32.1% | $6 793 675 | $100 000 008 | $237 647 715 | 0,42 | $17 278 352 | $2 382 344 |  |
||
| 4 |
 Strategy |
$97,36 | 0.1% | 0.5% | 7.0% | 19.4% | 28.0% | $2 351 519 | $95 560 190 | $193 260 318 | 0,49 | $3 450 396 | $2 918 570 | 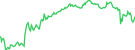 |
||
| 5 |
 SpaceX |
$141,86 | 0.0% | 0.3% | 1.6% | 0.2% | 0.8% | $6 358 139 | $81 637 393 | $242 633 857 | 0,34 | - | - | 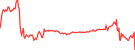 |
||
| 6 |
 SPDR S&P 500 ETF Trust |
$737,33 | 0.7% | 0.2% | 1.3% | 2.4% | 3.7% | $4 306 026 | $75 115 575 | $207 032 598 | 0,36 | $2 885 707 | $2 269 789 | 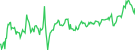 |
||
| 7 |
 Invesco QQQ ETF |
$658,72 | 0.2% | 0.4% | 1.3% | 2.6% | 7.2% | $1 576 915 | $72 484 724 | $210 995 024 | 0,34 | $2 120 057 | $1 347 936 | 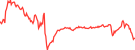 |
||
| 8 |
 Tesla |
$379,96 | 0.1% | 0.1% | 0.5% | 0.3% | 9.1% | $8 180 326 | $67 249 776 | $222 085 368 | 0,30 | $2 080 023 | $1 263 407 | 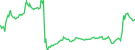 |
||
| 9 |
 Alphabet Class A |
$279,78 | 0.0% | 0.0% | 1.8% | 2.7% | 17.4% | $4 564 809 | $63 185 882 | $179 291 703 | 0,35 | $120 258 875 | $2 400 286 | 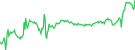 |
||
| 10 |
 Intel |
$55,11 | 0.2% | 0.8% | 2.7% | 5.8% | 37.3% | $582 379 | $26 216 127 | $132 404 653 | 0,20 | $360 709 | $252 958 | 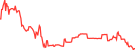 |
||
| 11 |
 SanDisk |
$804,36 | 0.0% | 0.0% | 2.5% | 7.0% | 36.9% | $757 843 | $23 585 423 | $88 316 425 | 0,27 | - | - | 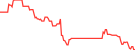 |
||
| 12 |
 iShares $ Treasury Bond 0-1yr UCITS ETF |
$121,80 | 0.7% | - | 0.0% | 0.0% | 0.2% | - | $18 960 097 | $18 960 097 | 1,00 | - | - |  |
||
| 13 |
 Apple |
$352,57 | 0.3% | 0.3% | 0.2% | 0.9% | 2.6% | $5 922 286 | $12 309 627 | $235 381 338 | 0,05 | $1 688 587 | $2 444 603 |  |
||
| 14 |
 Coinbase |
$115,53 | 0.2% | 0.7% | 4.0% | 12.2% | 32.2% | $5 955 939 | $11 266 730 | $104 505 693 | 0,11 | $38 791 233 | $11 023 317 |  |
||
| 15 |
 SPDR Gold Shares |
$352,41 | 0.1% | 0.1% | 0.5% | 4.7% | 7.4% | $2 525 150 | $10 383 047 | $125 345 184 | 0,08 | $738 522 | $747 920 |  |
||
| 16 |
 Meta Platforms |
$619,76 | 0.1% | 0.1% | 1.5% | 3.9% | 12.0% | $2 808 472 | $9 973 167 | $138 244 666 | 0,07 | $12 318 682 | $8 232 529 | 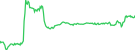 |
||
| 17 |
 Amazon |
$257,88 | 0.2% | 0.4% | 0.1% | 5.3% | 3.6% | $4 224 807 | $9 541 229 | $143 450 224 | 0,07 | $16 425 841 | $2 297 795 | 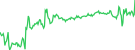 |
||
| 18 |
 SK Hynix - ADR |
$122,74 | 0.3% | 0.1% | 2.5% | 6.0% | 8.1% | $349 048 | $9 260 421 | $72 519 328 | 0,13 | - | - | 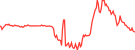 |
||
| 19 |
SPDR S&P 500 ETF Trust
|
$738,12 | 0.8% | 0.2% | 1.2% | 2.5% | 3.6% | $1 979 650 | $8 036 097 | $8 036 097 | 1,00 | - | - | 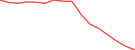 |
||
| 20 |
 Robinhood Markets |
$69,25 | 0.1% | 0.9% | 4.3% | 14.4% | 28.5% | $5 268 744 | $7 903 861 | $144 247 583 | 0,05 | $6 468 150 | $999 083 | 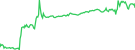 |
||
| 21 |
 Microsoft |
$507,59 | 0.5% | 0.2% | 2.9% | 5.5% | 4.0% | $1 688 069 | $7 639 247 | $153 088 253 | 0,05 | - | - | 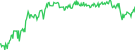 |
||
| 22 |
 Broadcom |
$342,96 | 0.0% | 0.4% | 1.6% | 2.2% | 3.8% | $3 135 864 | $6 950 997 | $98 873 533 | 0,07 | $9 306 991 | $59 799,65 | 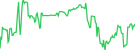 |
||
| 23 |
 Advanced Micro Devices |
$505,92 | 0.4% | 1.9% | 2.0% | 3.1% | 4.3% | $682 084 | $6 669 789 | $187 870 512 | 0,04 | - | - | 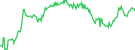 |
||
| 24 |
 ProShares UltraPro QQQ |
$52,40 | 0.8% | 0.0% | 3.4% | 7.4% | 23.8% | $49 648,61 | $6 302 065 | $130 726 712 | 0,05 | $28 782 393 | $15 294 628 |  |
||
| 25 |
Invesco QQQ ETF
|
$659,47 | 0.3% | 0.4% | 1.3% | 2.7% | 7.2% | $2 698 229 | $5 699 480 | $5 699 480 | 1,00 | - | - |  |
||
| 26 |
 Marvell Technology |
$149,33 | 0.1% | 0.4% | 0.2% | 4.7% | 35.6% | $19 658,20 | $5 255 732 | $166 974 174 | 0,03 | - | - |  |
||
| 27 |
 Taiwan Semiconductor Manufacturing - ADR |
$360,95 | 0.4% | 0.0% | 4.7% | 8.8% | 14.5% | $15 811,34 | $5 073 509 | $95 654 073 | 0,05 | - | - |  |
||
| 28 |
 Oracle |
$116,73 | 1.1% | 0.2% | 5.9% | 2.5% | 11.5% | $19 390,38 | $4 411 884 | $74 499 014 | 0,06 | $9 590,53 | $609 450 | 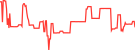 |
||
| 29 |
 BitMine Immersion Technologies |
$16,20 | 1.0% | 0.0% | 1.1% | 9.3% | 24.0% | $2 838,18 | $3 738 573 | $69 616 011 | 0,05 | - | - | 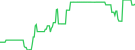 |
||
| 30 |
 Palantir Technologies |
$156,88 | 0.4% | 0.5% | 2.7% | 6.6% | 15.3% | $93 530,79 | $2 729 730 | $161 706 169 | 0,02 | $16 517,73 | $8 541,61 | 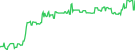 |
||
| 31 |
 KRAQ |
$41,43 | 312.6% | - | 306.5% | 306.5% | 315.1% | - | $2 698 373 | $309 682 403 | 0,01 | - | - |  |
||
| 32 |
Nvidia
|
$155,77 | 0.1% | 1.0% | 1.2% | 7.6% | 27.0% | $3 586 183 | $2 528 246 | $2 528 246 | 1,00 | - | - | 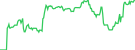 |
||
| 33 |
 iShares $ Treasury Bond 1-3yr UCITS ETF |
$5,95 | 0.6% | - | 0.1% | 0.3% | 0.5% | - | $2 463 937 | $2 463 937 | 1,00 | - | - |  |
||
| 34 |
SpaceX
|
$141,74 | 0.1% | 0.2% | 1.6% | 0.2% | 1.0% | $2 052 122 | $2 325 450 | $2 325 450 | 1,00 | - | - |  |
||
| 35 |
 McDonald's |
$279,25 | 1.2% | 0.3% | 0.4% | 0.6% | 13.7% | $1 777 071 | $2 297 656 | $93 911 441 | 0,02 | $879 082 | $639 703 |  |
||
| 36 |
 Berkshire Hathaway |
$586,95 | 0.1% | 0.1% | 0.4% | 1.0% | 11.3% | $13 336,70 | $2 240 573 | $116 655 568 | 0,02 | - | - |  |
||
| 37 |
 Netflix |
$59,47 | 0.5% | 0.3% | 1.6% | 4.9% | 15.3% | $44 911,28 | $2 207 276 | $211 134 457 | 0,01 | - | - |  |
||
| 38 |
 GameStop |
$25,43 | 0.5% | 0.7% | 2.1% | 0.8% | 5.9% | $396 303 | $2 063 344 | $125 317 918 | 0,02 | - | - |  |
||
| 39 |
Tesla
|
$380,35 | 0.0% | 0.2% | 0.7% | 0.5% | 9.1% | $1 441 128 | $1 916 509 | $1 916 509 | 1,00 | - | - |  |
||
| 40 |
 Vanguard Total Stock Market ETF |
$361,60 | 0.4% | 0.2% | 0.6% | 3.2% | 3.1% | $17 475,52 | $1 774 161 | $131 137 003 | 0,01 | - | - |  |
||
| 41 |
 MARA Holdings |
$6,45 | 0.2% | 0.0% | 1.7% | 6.8% | 149.9% | $1 885,18 | $1 540 380 | $77 668 959 | 0,02 | - | - |  |
||
| 42 |
 iShares Silver Trust |
$42,80 | 0.2% | 0.6% | 0.3% | 8.1% | 16.9% | $3 611,33 | $1 401 204 | $62 197 698 | 0,02 | - | - |  |
||
| 43 |
 Eli Lilly |
$1 416,31 | 0.1% | 0.2% | 2.0% | 1.1% | 9.8% | $19 967,22 | $1 323 283 | $163 302 021 | 0,01 | - | - |  |
||
| 44 |
 Coca-Cola |
$100,79 | 1.9% | 0.0% | 0.2% | 3.7% | 5.7% | $86 035,51 | $1 170 959 | $147 139 022 | 0,01 | $393 525 | $31 429,60 |  |
||
| 45 |
 ASML Holding NV |
$1 363,56 | 1.7% | 0.0% | 4.5% | 10.9% | 17.3% | $1 313,38 | $1 151 834 | $105 858 859 | 0,01 | - | - |  |
||
| 46 |
 AppLovin |
$395,67 | 1.1% | 2.2% | 4.5% | 1.7% | 48.7% | $1 678,75 | $1 061 760 | $112 894 411 | 0,01 | - | - |  |
||
| 47 |
 IBM |
$231,52 | 0.0% | 0.8% | 4.9% | 5.1% | 0.1% | $20 387,16 | $1 021 353 | $84 236 489 | 0,01 | - | - |  |
||
| 48 |
 Invesco Short Term Treasury ETF |
$105,62 | 0.2% | 0.0% | 0.3% | 0.1% | 0.1% | $256,23 | $883 573 | $624 515 383 | 0,00 | - | - | 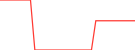 |
||
| 49 |
Circle Internet Group
|
$55,04 | 0.0% | 0.1% | 5.7% | 14.9% | 32.3% | $664 463 | $862 468 | $862 468 | 1,00 | - | - |  |
||
| 50 |
 VanEck Semiconductor ETF |
$461,65 | 0.1% | 1.0% | 2.4% | - | - | $409 631 | $823 774 | $823 774 | 1,00 | - | - | 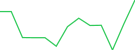 |
||
| 51 |
 Chevron |
$216,16 | 0.1% | 0.0% | 0.8% | 2.1% | 8.8% | $596,20 | $804 148 | $131 134 492 | 0,01 | - | - | 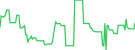 |
||
| 52 |
SK Hynix - ADR
|
$122,94 | 0.1% | 1.0% | 1.8% | 5.6% | 8.1% | $988 589 | $781 741 | $781 741 | 1,00 | - | - |  |
||
| 53 |
 CrowdStrike |
$215,22 | 2.1% | 0.7% | 3.7% | 4.3% | 5.3% | $618,38 | $767 497 | $199 841 189 | 0,00 | - | - | 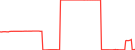 |
||
| 54 |
 Micron Technology |
$715,48 | 0.0% | 2.0% | 2.7% | - | - | $1 141 343 | $738 946 | $738 946 | 1,00 | - | - |  |
||
| 55 |
 Exxon Mobil |
$170,97 | 2.3% | 0.2% | 1.7% | 2.9% | 5.0% | $662,81 | $674 298 | $133 591 771 | 0,01 | - | - |  |
||
| 56 |
 iShares Russell 2000 ETF |
$268,68 | 0.1% | - | 3.1% | 3.9% | 1.5% | $235,77 | $638 343 | $101 098 969 | 0,01 | - | - |  |
||
| 57 |
 DeFi Development Corp. |
$2,80 | 0.4% | 1.1% | 0.8% | 10.6% | 24.5% | $74 580,62 | $632 723 | $632 723 | 1,00 | $46 072,51 | $139 635 |  |
||
| 58 |
 Johnson & Johnson |
$281,74 | 1.0% | 0.0% | 1.0% | 0.1% | 10.2% | $39,82 | $627 100 | $115 108 011 | 0,01 | - | - |  |
||
| 59 |
 Vanguard Total World |
$155,68 | 3.3% | - | 0.0% | 1.7% | 2.1% | - | $594 135 | $116 513 160 | 0,01 | - | - |  |
||
| 60 |
 UnitedHealth |
$387,78 | 0.6% | 1.2% | 4.9% | 3.7% | 2.7% | $42 643,15 | $583 611 | $145 272 931 | 0,00 | - | - |  |
||
| 61 |
 Novo Nordisk |
$42,04 | 3.1% | 0.0% | 0.3% | 3.4% | 8.2% | $8,00 | $557 918 | $90 265 967 | 0,01 | - | - |  |
||
| 62 |
 JPMorgan Chase |
$338,05 | 2.4% | 1.1% | 2.2% | 1.7% | 1.0% | $194,27 | $555 139 | $103 453 987 | 0,01 | - | - |  |
||
| 63 |
 Cisco Systems |
$94,87 | 0.2% | 0.0% | 0.5% | 3.4% | 11.6% | $26 903,86 | $552 127 | $108 134 534 | 0,01 | - | - | 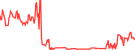 |
||
| 64 |
 State Street Energy Select Sector SPDR Fund |
$64,09 | 1.3% | 0.0% | 1.2% | 3.2% | 6.6% | $357,98 | $535 087 | $78 774 145 | 0,01 | - | - | 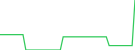 |
||
| 65 |
 Salesforce |
$197,97 | 1.6% | 0.0% | 7.5% | 5.9% | 14.2% | $11,65 | $509 239 | $98 615 801 | 0,01 | - | - | 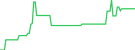 |
||
| 66 |
 Jersey Mike's Subs |
$19,84 | 5.7% | - | 17.9% | 17.9% | 20.3% | - | $502 721 | $502 721 | 1,00 | - | - |  |
||
| 67 |
 Moderna |
$205,86 | 0.4% | 0.0% | 5.2% | 18.6% | 7.4% | $4 896,71 | $441 143 | $187 360 809 | 0,00 | - | - |  |
||
| 68 |
 Goldman Sachs |
$863,69 | 1.6% | 0.0% | 2.6% | 4.0% | 4.3% | $2 708,55 | $411 785 | $109 063 268 | 0,00 | - | - | 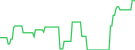 |
||
| 69 |
 Visa |
$410,15 | 1.6% | 2.3% | 3.7% | 3.3% | 70.2% | $306,03 | $408 753 | $126 040 396 | 0,00 | - | - | 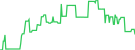 |
||
| 70 |
 TON |
$2,84 | 0.7% | 0.0% | 0.7% | 0.7% | 4.8% | $4 855,42 | $378 390 | $105 020 773 | 0,00 | - | - | 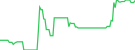 |
||
| 71 |
 Procter & Gamble |
$170,97 | 0.5% | 0.1% | 0.3% | 1.1% | 8.2% | $13 703,80 | $364 208 | $120 352 555 | 0,00 | - | - | 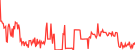 |
||
| 72 |
Alphabet Class A
|
$280,40 | 0.2% | 0.2% | 1.6% | 2.6% | 17.3% | $240 640 | $360 015 | $360 015 | 1,00 | - | - | 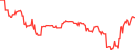 |
||
| 73 |
 Pfizer |
$29,10 | 2.1% | 0.1% | 2.0% | 3.5% | 3.7% | $349 098 | $357 388 | $130 893 488 | 0,00 | - | - | 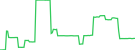 |
||
| 74 |
 Amber |
$1,55 | 0.1% | 0.0% | 7.7% | 11.4% | 21.8% | $1 495,27 | $332 855 | $92 871 579 | 0,00 | - | - | 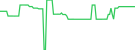 |
||
| 75 |
 PepsiCo |
$143,97 | 1.4% | 0.4% | 1.8% | 0.3% | 10.1% | $17 579,60 | $330 740 | $103 955 430 | 0,00 | - | - | 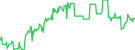 |
||
| 76 |
 AbbVie |
$291,34 | 0.9% | 0.0% | 0.5% | 0.7% | 4.0% | $18 800,15 | $329 332 | $126 647 810 | 0,00 | - | - | 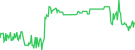 |
||
| 77 |
 Global X Copper Miners ETF |
$65,08 | 0.1% | 0.0% | 1.2% | 9.9% | 18.8% | $219,64 | $314 953 | $72 164 387 | 0,00 | - | - | 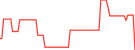 |
||
| 78 |
 Fundrise Innovation Fund |
$19,01 | 16.1% | - | 0.0% | 10.8% | 151.9% | - | $269 720 | $52 124 802 | 0,01 | - | - |  |
||
| 79 |
Strategy
|
$97,29 | 0.2% | 0.2% | 6.8% | 19.4% | 28.3% | $341 672 | $269 445 | $269 445 | 1,00 | - | - |  |
||
| 80 |
 Bank of America |
$51,40 | 3.9% | 0.0% | 4.8% | 3.1% | 0.2% | $97,08 | $255 600 | $102 365 228 | 0,00 | - | - | 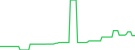 |
||
| 81 |
 iShares Core MSCI Emerging Markets ETF |
$72,03 | 1.5% | - | 2.3% | 3.6% | 7.5% | - | $250 033 | $250 033 | 1,00 | - | - | 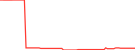 |
||
| 82 |
 Uber |
$68,23 | 0.8% | 0.0% | 5.1% | 1.6% | 7.0% | $491,67 | $248 208 | $100 377 146 | 0,00 | - | - | 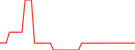 |
||
| 83 |
Microsoft
|
$508,44 | 0.6% | 0.1% | 2.7% | 5.5% | 4.0% | $235 678 | $246 416 | $246 416 | 1,00 | - | - |  |
||
| 84 |
Meta Platforms
|
$620,81 | 0.3% | 0.1% | 1.5% | 4.0% | 11.9% | $290 621 | $240 395 | $240 395 | 1,00 | - | - |  |
||
| 85 |
 abrdn Physical Platinum Shares ETF |
$12,89 | 0.0% | 0.0% | 1.7% | 8.6% | 12.7% | $1 134,47 | $237 581 | $67 531 259 | 0,00 | - | - | 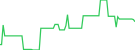 |
||
| 86 |
 PayPal |
$58,88 | 0.7% | 0.0% | 0.0% | 1.6% | 5.1% | - | $231 562 | $104 972 542 | 0,00 | - | - | 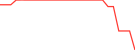 |
||
| 87 |
 Pop Mart International |
$18,24 | 0.4% | 0.1% | 0.3% | 1.7% | 1.1% | $61 392,09 | $229 235 | $229 235 | 1,00 | - | - | 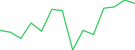 |
||
| 88 |
 Walmart |
$126,12 | 0.9% | 0.0% | 0.3% | 1.8% | 4.5% | $290,07 | $223 757 | $127 367 053 | 0,00 | - | - | 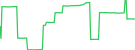 |
||
| 89 |
Apple
|
$352,70 | 0.4% | 0.3% | 0.3% | 0.8% | 2.8% | $85 188,70 | $220 398 | $220 398 | 1,00 | - | - |  |
||
| 90 |
 Comcast |
$25,44 | 0.1% | 0.0% | 1.3% | 2.2% | 15.3% | $8 540,17 | $216 245 | $96 101 107 | 0,00 | - | - |  |
||
| 91 |
 Oklo |
$23,40 | 5.0% | 0.0% | 0.6% | 12.8% | 28.7% | - | $211 537 | $67 906 045 | 0,00 | - | - |  |
||
| 92 |
 Schwab International Equity ETF |
$26,50 | 1.2% | 0.0% | 0.0% | 1.5% | 4.8% | - | $208 204 | $208 204 | 1,00 | - | - |  |
||
| 93 |
 Constellation Energy |
$281,02 | 5.6% | 0.0% | 2.6% | 2.1% | 3.3% | $12,09 | $207 849 | $69 243 741 | 0,00 | - | - |  |
||
| 94 |
 Tencent - ADR |
$48,35 | 2.4% | 0.1% | 2.3% | 8.6% | 10.7% | $41 930,19 | $202 311 | $202 311 | 1,00 | - | - |  |
||
| 95 |
 Global X Uranium ETF |
$30,52 | 1.3% | - | 23.5% | 23.2% | 39.0% | - | $200 669 | $36 216 502 | 0,01 | - | - |  |
||
| 96 |
 Merck |
$143,94 | 0.4% | 0.0% | 0.5% | 3.0% | 2.2% | $4,00 | $195 363 | $139 989 805 | 0,00 | - | - |  |
||
| 97 |
 Accenture |
$240,64 | 0.6% | 0.1% | 3.1% | 7.1% | 7.1% | $16 209,03 | $184 343 | $111 627 527 | 0,00 | - | - |  |
||
| 98 |
 Riot Platforms |
$17,48 | 2.5% | 0.0% | 3.0% | 2.8% | 28.0% | $24,16 | $182 612 | $110 638 311 | 0,00 | - | - |  |
||
| 99 |
 Danaher |
$227,69 | 0.8% | 0.1% | 1.4% | 3.2% | 1.3% | $7 962,45 | $171 854 | $101 035 737 | 0,00 | - | - |  |
||
| 100 |
 abrdn Physical Palladium Shares ETF |
$17,76 | 1.2% | 0.0% | 0.7% | 6.8% | 12.4% | $582,20 | $169 948 | $65 757 860 | 0,00 | - | - |  |


About xStocks
Are you the issuer? Submit a request to keep your details up to date.
Issuance
Identity
Issuing Entity
Backed Assets (JE) Limited
The legal company that issues this token. This may differ from the brand name.
Domicile
🇯🇪 Jersey
The country where it's registered.
Issuance Framework
Where and under which rules this product is offered. Some products involve several countries' laws.
🇱🇮 Liechtenstein · FMA · EU Prospectus Regulation base prospectus, passported across the EEA
🇯🇪 Jersey · JFSC · Jersey issuer consents
🇺🇸 United States · none · not registered
Structure
Tokenization Model
What the token legally is: the real asset, an interest in an asset held for you, or the issuer's own contract that tracks the price.
Third-Party Synthetic
The token is the issuer's own note or derivative that tracks the price. No real asset is held for you.
Legal Instrument
The legal form of what you hold: a share, fund unit, note, derivative, or claim on physical commodity.
Debt Security
A note owed to you by the token issuer. You're effectively a lender, with returns tied to the asset's price.
Claim Against
Who your claim points to: the real asset's issuer, a fund, the physical commodity itself, or the company that issued the token.
RWA Token Issuer
You're a creditor or counterparty of the company that issued the token, not an owner of the asset.
Backing Type
What stands behind your token: assets held specifically for you, a shared pool, pledged collateral, or only the issuer's promise.
Collateralized
Assets are pledged to holders, enforced by a security agent if needed. Recovery is capped at the collateral.
Holder Rights
Voting
Whether you can vote at shareholder or fund meetings, and how.
None
No voting rights.
Dividend
Whether and how you receive dividends or income from the underlying asset.
Reinvested Rebase
Payouts are reinvested automatically. Your token balance or value grows instead of you receiving cash.
Corporate Actions
How events like stock splits or mergers affect your holding.
Rebase
Your holding is adjusted to reflect events like splits, but you don't take part as a shareholder.
Pre-emptive Subscription Rights
Whether you get first right to buy new shares when the company issues more.
None
You don't get first right to buy new shares.
Information Disclosure Rights
What information you're legally entitled to receive, and from whom.
Via Platform, No Inspection Rights
The platform publishes data like NAV or proof-of-reserves. You have no legal right to inspect the issuer's books.
Enforcement / Legal Rights
Who you can take legal action against to enforce your rights.
Against Issuing Entity or SPV
You can pursue the token issuer, fund or special-purpose company, but your reach stops there.
Residual Liquidation Claim
What you'd be entitled to if the issuer went bankrupt, and how you'd rank against other creditors.
Secured Creditor on Collateral
You have a claim on specific pledged collateral if the issuer fails. Recovery is capped at what it sells for.
Access
Redemption
Whether you can return the token to the issuer, what you'd get back (cash or the real asset), and whether ID checks apply.
Cash Only
You can redeem the token with the issuer for cash.
Redemption KYC Required
Yes
Whether you must verify your identity before redeeming with the issuer.
Open to US Persons
No
Whether US persons are allowed to hold or buy this product.
KYC Required
No
Whether you must verify your identity to hold or buy this product.
Sophisticated Investors Only
No
Whether only professional, accredited or qualified investors can hold this product.
Transferability
Whether you can send this token to other wallets freely, only to approved wallets, or not at all.
Open
Freely transferable on-chain. Sanctions screening or issuer freezes may still apply.
Source
Evidence
assets.backed.fi
Info based on issuer documents listed above. Refer to the source for full terms.
xStocks Statistics
24h Volume by Token
24h Perps Volume by Token
Volume
Trading volume of xStocks's tokens over time.
Perps Volume
Perps trading volume of xStocks's tokens over time.




 Eller kolla in den i appbutikerna


