Chainlink
LINK Price
How is the price of Chainlink (LINK) calculated?
The price of Chainlink (LINK) is calculated in real-time by aggregating the latest data across 221 exchanges and 474 markets, using a global volume-weighted average formula. Learn more about how crypto prices are calculated on CoinGecko.
Chainlink Price Chart (LINK)
| 1h | 24h | 7d | 14d | 30d | 1y |
|---|---|---|---|---|---|
| 0.1% | 1.1% | 6.1% | 4.3% | 6.5% | 107.7% |
LINK Converter
|
Market Cap
Market Cap = Current Price x Circulating Supply
Refers to the total market value of a cryptocurrency’s circulating supply. It is similar to the stock market’s measurement of multiplying price per share by shares readily available in the market (not held & locked by insiders, governments) Read More |
$7,930,163,596 |
|---|---|
|
Market Cap / FDV
The proportion of current market capitalization compares to market capitalization when meeting max supply.
The closer the Mkt Cap/FDV to 1, the closer the current market capitalization to its fully diluted valuation and vice versa. Learn more about Mkt Cap/FDV here. |
0.59 |
|
Fully Diluted Valuation
Fully Diluted Valuation (FDV) = Current Price x Total Supply
Fully Diluted Valuation (FDV) is the theoretical market capitalization of a coin if the entirety of its supply is in circulation, based on its current market price. The FDV value is theoretical as increasing the circulating supply of a coin may impact its market price. Also depending on the tokenomics, emission schedule or lock-up period of a coin's supply, it may take a significant time before its entire supply is released into circulation. Learn more about FDV here. |
$13,507,347,954 |
|
24 Hour Trading Vol
A measure of a cryptocurrency trading volume across all tracked platforms in the last 24 hours. This is tracked on a rolling 24-hour basis with no open/closing times.
Read More |
$173,548,157 |
|
Circulating Supply
The amount of coins that are circulating in the market and are tradeable by the public. It is comparable to looking at shares readily available in the market (not held & locked by insiders, governments).
Read More |
587,099,971
Total
1,000,000,000
Locked Wallet
(0x98c6)
- 26
Locked Wallet
(0xe036)
- 1
Locked Wallet
(0x5A8e)
- 30,000,000
Locked Wallet
(0xe0b6)
- 30,000,000
Locked Wallet
(0xa42D)
- 30,000,000
Locked Wallet
(0x5Eab)
- 3,000,000
Locked Wallet
(0x8d34)
- 500,000
Locked Wallet
(0x3739)
- 400,000
Locked Wallet
(0xfB68)
- 23,000,000
Locked Wallet
(0x9c17)
- 30,000,000
Locked Wallet
(0xD481)
- 22,000,000
Locked Wallet
(0x35a5)
- 30,000,000
Locked Wallet
(0x0DFf)
- 30,000,000
Locked Wallet
(0x7628)
- 30,000,000
Locked Wallet
(0x9BBb)
- 30,000,000
Locked Wallet
(0x7594)
- 30,000,000
Locked Wallet
(0x8652)
- 30,000,000
Locked Wallet
(0x1572)
- 22,000,000
Locked Wallet
(0x55b0)
- 19,000,000
Locked Wallet
(0x4a87)
- 23,000,000
Est. Circulating Supply
587,099,971
|
|
Total Supply
The amount of coins that have already been created, minus any coins that have been burned (removed from circulation). It is comparable to outstanding shares in the stock market.
Total Supply = Onchain supply - burned tokens |
1,000,000,000 |
|
Max Supply
The maximum number of coins coded to exist in the lifetime of the cryptocurrency. It is comparable to the maximum number of issuable shares in the stock market.
Max Supply = Theoretical maximum as coded |
1,000,000,000 |


LINK Historical Price
| 24h Range | $13.29 – $13.58 |
|---|---|
| 7d Range | $13.30 – $15.13 |
| All-Time High |
$52.70
74.3%
May 10, 2021 (about 3 years)
|
| All-Time Low |
$0.1482
9022.7%
Nov 29, 2017 (over 6 years)
|
How do you feel about LINK today?
Recently happened to Chainlink
What is Chainlink?
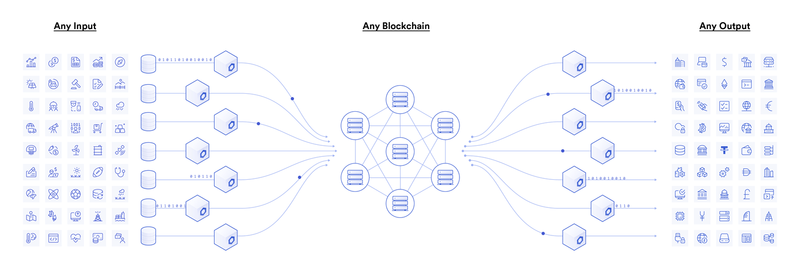
Chainlink is a framework for building Decentralized Oracle Networks (DONs) that bring real-world data onto blockchain networks, enabling the creation of hybrid smart contracts. These DONs provide decentralized services such as Price Feeds, Proof of Reserve, Verifiable Randomness, Keepers, and the ability to connect to any web API.
It aims to ensure that the external information (pricing, weather data, event outcomes, etc.) and off-chain computations (randomness, transaction automation, fair ordering, etc.) fed to on-chain smart contracts are reliable and tamper-proof.
Chainlink oracle networks are blockchain-agnostic and are incentivized through the native LINK token, used for node payments and network collateral.
Watch a video to learn about Chainlink.
A brief history of Chainlink
Chainlink is an open-source protocol developed by Chainlink Labs (formerly Smart Contract Ltd.), founded in 2014 by Sergey Nazarov and Steve Ellis.
The Chainlink Network went live on the Ethereum mainnet on June 1st, 2019 and has since expanded to support additional blockchains and layer 2 networks such as Polygon, BSC, Avalanche, Arbitrum, and more.
What is the purpose of Chainlink?
To understand the purpose and function of Chainlink, we will split it into two sections:
- The Chainlink Network
- The Chainlink (LINK) token
The Chainlink Network
Before we dive into the function of the Chainlink Network, we need to understand the basics of smart contracts and how oracles work.
Smart contracts are programmatic code (if x event occurs, execute y action) that operate on a blockchain network. However, due to the security model of blockchain networks, smart contracts are isolated from the external world and cannot natively connect to off-chain systems.
To overcome this problem, an additional piece of infrastructure is required known as an “oracle” which relays data from the real world onto blockchain networks, where it can be consumed by smart contracts.
The Chainlink Network addresses this issue through Decentralized Oracle Networks (DONs) that consist of a network of independent oracle node operators that fetch, aggregate, validate, and deliver real-world data on-chain. Each oracle node can specialize in providing different decentralized services on the behalf of smart contracts.
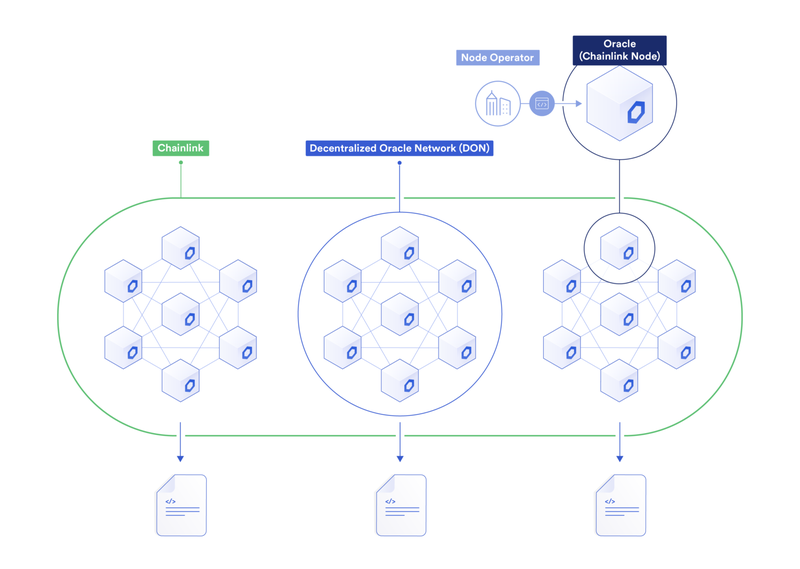
Chainlink DONs support two different ways of delivering off-chain data to on-chain smart contracts. This includes the basic request model and the decentralized data model.
- Basic Request Model: Smart contracts generate and submit a data request to Chainlink oracle nodes in one transaction and receive the response later in time within a separate transaction.
- Decentralized Data Model: A shared data resource where Chainlink oracle nodes regularly update an on-chain reference contract with fresh data, allowing smart contracts to query and receive real-world data in a single transaction.
The decentralized data model is powered by Chainlink nodes using the Off-Chain Reporting Protocol (OCR), where data is fetched and aggregated off-chain, before a single transaction is submitted on-chain containing each node’s signature and corresponding data point.
The Chainlink Token (LINK)
LINK is an ERC-677 token that is used to incentivize the proper operation of Chainlink DONs. The token has also been bridged across multiple blockchains to enable native Chainlink oracle integrations.
The LINK token is used within the Chainlink Network for the following components:
- Node Operators Fees: Smart contracts are required to pay Chainlink nodes using LINK tokens to obtain access to real-world data and other oracle services.
- Implicit Staking: The current and future revenue of Chainlink nodes are denominated in LINK tokens, incentivizing the proper operation of the Chainlink Network.
- Explicit Staking: Chainlink nodes in the future can be required to lock up LINK tokens as collateral to back their oracle services, which can be slashed for malicious behavior.
Who uses Chainlink?
The Chainlink Network is used by smart contract applications that require access to real-world data and off-chain computations. The network is also used by data providers to monetize their datasets by selling their APIs to smart contract applications.
The most common use case includes securing Decentralized Finance (DeFi) protocols which require financial market data. The Chainlink Network offers a variety of on-chain data feeds that are used to secure tens of billions of dollars. Integrated applications include Aave, Compound, Synthetix, and more.
Where can you buy Chainlink?
LINK tokens can be traded on centralized crypto exchanges. The most popular exchange to buy and trade Chainlink is Gate.io, where the most active trading pair LINK/USDT has a trading volume of $1,828,961.80 in the last 24 hours. Other popular options include WhiteBIT and C-Patex.
What is the daily trading volume of Chainlink (LINK)?
The trading volume of Chainlink (LINK) is $173,574,767.20 in the last 24 hours, representing a -22.30% decrease from one day ago and signalling a recent fall in market activity.
What is the all-time high for Chainlink (LINK)?
The highest price paid for Chainlink (LINK) is BTC0.001672, which was recorded on May 10, 2021 (about 3 years). Comparatively, the current price is -74.30% lower than the all-time high price.
What is the all-time low for Chainlink (LINK)?
The lowest price paid for Chainlink (LINK) is BTC0.00001335, which was recorded on Nov 29, 2017 (over 6 years). Comparatively, the current price is 9,022.70% higher than the all-time low price.
What is the market cap of Chainlink (LINK)?
Market capitalization of Chainlink (LINK) is BTC129,427.3110 and is ranked #18 on CoinGecko today. Market cap is measured by multiplying token price with the circulating supply of LINK tokens (590 Million tokens are tradable on the market today).
What is the fully diluted valuation of Chainlink (LINK)?
The fully diluted valuation (FDV) of Chainlink (LINK) is BTC220,451.9116. This is a statistical representation of the maximum market cap, assuming the maximum number of 1 Billion LINK tokens are in circulation today. Depending on how the emission schedule of LINK tokens are designed, it might take multiple years before FDV is realized.
How does the price performance of Chainlink compare against its peers?
With a price decline of -6.10% in the last 7 days, Chainlink (LINK) is underperforming the global cryptocurrency market which is down -4.30%, while underperforming when compared to similar Polygon Ecosystem cryptocurrencies which are up 0.00%.
How to add Chainlink (LINK) to MetaMask?
Adding Chainlink (LINK) to MetaMask allows you to view your token holdings, trade on decentralized exchanges, and more. To add them, you’ll need to import LINK as a token. You can copy LINK’s contract address (0x514910771af9ca656af840dff83e8264ecf986ca) and import it manually, or if you've installed MetaMask's chrome extension, add LINK to MetaMask with one click on CoinGecko.
Add LINK to MetaMask.
Chainlink Markets
| # | Exchange | Pair | Price | Spread | +2% Depth | -2% Depth | 24h Volume | Volume % | Last Updated | Trust Score | |
|---|---|---|---|---|---|---|---|---|---|---|---|
| 1 |
CEX
|
$13.50 | 0.03% | $2,904,270 | $3,709,771 | $4,799,691 | 2.76% |
Recently
|
|||
| 2 |
CEX
|
$13.50 | 0.02% | $1,925,987 | $1,455,867 | $1,827,329 | 1.05% |
Recently
|
|||
| 3 |
CEX
|
$13.53 | 0.02% | $1,315,736 | $1,346,207 | $747,776 | 0.43% |
Recently
|
|||
| 4 |
CEX
|
$13.50 | 0.02% | $1,226,493 | $1,417,734 | $1,143,223 | 0.66% |
Recently
|
|||
| 5 |
CEX
|
$13.49 | 0.02% | $1,016,514 | $1,007,055 | $140,854 | 0.08% |
Recently
|
|||
| 6 |
CEX
|
$13.49 | 0.02% | $973,936 | $1,005,233 | $1,302,423 | 0.75% |
Recently
|
|||
| 7 |
CEX
|
$13.48 | 0.02% | $911,722 | $1,013,822 | $2,296,943 | 1.32% |
Recently
|
|||
| 8 |
CEX
|
$13.49 | 0.01% | $737,362 | $777,847 | $549,654 | 0.32% |
Recently
|
|||
| 9 |
CEX
|
$13.49 | 0.01% | $568,664 | $653,537 | $447,264 | 0.26% |
Recently
|
|||
| 10 |
CEX
|
$13.53 | 0.02% | $712,259 | $789,546 | $12,760,895 | 7.33% |
Recently
|
|||


Chainlink Latest News


Chainlink Guides


 Or check it out in the app stores