Portfolios
Add to New Portfolio
Top DragonFly Capital Portfolio Coins by Market Cap
The DragonFly Capital Portfolio market cap today is $52.3 Billion, a 2.7% change in the last 24 hours.
Read More about DragonFly Capital Portfolio
Protocols and tokens that DragonFly Capital have invested in.
Highlights
$52,330,112,181
Market Cap
2.7%

$2,612,616,943
24h Trading Volume
| # | Coin | Price | 1h | 24h | 7d | 30d | 24h Volume | Market Cap | FDV | Market Cap / FDV | Last 7 Days | ||
|---|---|---|---|---|---|---|---|---|---|---|---|---|---|
| 13 |
Avalanche
AVAX
|
Buy
|
$36.44 | 0.1% | 5.9% | 7.9% | 7.3% | $460,684,587 | $13,939,357,867 | $16,078,154,042 | 0.87 |

|
|
| 19 |

NEAR Protocol
NEAR
|
Buy
|
$8.04 | 0.7% | 0.0% | 10.9% | 47.0% | $625,193,703 | $8,640,934,140 | $9,492,947,553 | 0.91 |

|
|
| 20 |

Polygon
MATIC
|
Buy
|
$0.7149 | 0.1% | 3.2% | 6.7% | 5.5% | $251,656,863 | $6,631,163,373 | $7,143,384,344 | 0.93 |

|
|
| 31 |

Aptos
APT
|
Buy
|
$8.64 | 0.5% | 3.7% | 2.2% | 6.9% | $121,696,223 | $3,753,895,942 | $9,472,530,030 | 0.4 |

|
|
| 35 |

Cosmos Hub
ATOM
|
Buy
|
$8.70 | 0.1% | 2.4% | 0.0% | 6.7% | $132,581,993 | $3,398,025,533 | $3,400,127,425 | 1.0 |

|
|
| 37 |
Mantle
MNT
|
Buy
|
$1.00 | 0.0% | 3.5% | 0.4% | 12.5% | $73,599,864 | $3,280,114,616 | $6,249,176,352 | 0.52 |

|
|
| 51 |

Maker
MKR
|
Buy
|
$2,790.79 | 0.3% | 3.4% | 5.0% | 11.6% | $76,702,512 | $2,582,669,927 | $2,728,362,054 | 0.95 |

|
|
| 67 |

Lido DAO
LDO
|
$1.80 | 1.0% | 11.8% | 1.9% | 6.4% | $122,893,144 | $1,609,511,185 | $1,803,737,436 | 0.89 |

|
||
| 68 |
Bitget Token
BGB
|
$1.08 | 0.4% | 0.7% | 0.8% | 12.6% | $60,194,076 | $1,518,916,977 | $2,169,879,846 | 0.7 |

|
||
| 81 |

dYdX
DYDX
|
$2.07 | 0.5% | 2.3% | 1.7% | 2.3% | $8,810,717 | $1,158,218,066 | $1,563,764,402 | 0.74 |

|
||
| 89 |

Ethena
ENA
|
$0.7290 | 0.2% | 8.6% | 13.6% | 22.6% | $302,287,421 | $1,078,116,140 | $10,936,908,269 | 0.1 |

|
||
| 112 |

Ribbon Finance
RBN
|
$0.8261 | 0.5% | 3.7% | 23.1% | 26.4% | $3,925,277 | $802,510,761 | $826,117,356 | 0.97 |

|
||
| 124 |

Nervos Network
CKB
|
$0.01627 | 1.3% | 10.2% | 0.2% | 24.1% | $53,561,014 | $717,727,084 | $728,874,062 | 0.98 |

|
||
| 148 |

WOO
WOO
|
$0.3001 | 0.4% | 6.6% | 6.5% | 6.9% | $17,582,715 | $560,260,479 | $668,342,538 | 0.84 |

|
||
| 174 |

1inch
1INCH
|
Buy
|
$0.3972 | 0.5% | 4.4% | 10.1% | 3.6% | $27,752,935 | $460,081,730 | $595,750,338 | 0.77 |

|
|
| 187 |

Siacoin
SC
|
$0.007205 | 0.5% | 4.2% | 4.7% | 3.8% | $4,079,690 | $411,584,967 | $411,768,216 | 1.0 |

|
||
| 190 |

Galxe
GAL
|
$3.53 | 0.3% | 3.0% | 12.1% | 3.2% | $11,560,829 | $406,942,043 | $704,580,224 | 0.58 |

|
||
| 285 |

RSS3
RSS3
|
$0.3230 | 0.1% | 1.7% | 4.2% | 6.9% | $4,565,144 | $217,264,593 | $321,913,214 | 0.67 |

|
||
| 309 |

Numeraire
NMR
|
$27.08 | 0.1% | 0.9% | 4.3% | 13.9% | $5,324,350 | $184,718,781 | $290,158,117 | 0.64 |

|
||
| 372 |

ApeX
APEX
|
$3.01 | 0.5% | 6.7% | 25.1% | 20.4% | $96,985,011 | $139,788,634 | $2,109,590,920 | 0.07 |

|
||
| 410 |
Hashflow
HFT
|
$0.3035 | 0.3% | 4.4% | 0.7% | 0.3% | $9,380,022 | $121,986,728 | $303,490,724 | 0.4 |

|
||
| 461 |
Secret
SCRT
|
$0.3790 | 0.1% | 2.9% | 1.9% | 7.1% | $2,719,900 | $102,812,580 | $111,792,051 | 0.92 |

|
||
| 460 |

Aurora
AURORA
|
Buy
|
$0.2202 | 0.5% | 14.4% | 1.6% | 11.9% | $2,174,084 | $102,145,104 | $220,018,311 | 0.46 |

|
|
| 506 |

Aevo
AEVO
|
$0.8263 | 0.6% | 3.7% | 30.3% | 48.3% | $89,717,415 | $90,928,761 | $826,625,104 | 0.11 |

|
||
| 521 |

BENQI
QI
|
$0.01858 | 0.1% | 3.6% | 5.9% | 14.5% | $3,928,197 | $84,031,123 | $133,784,593 | 0.63 |

|
||
| 577 |
Gelato
GEL
|
$0.2847 | 0.6% | 3.7% | 8.2% | 14.0% | $193,374 | $68,695,302 | $119,780,445 | 0.57 |

|
||
| 628 |

Shrapnel
SHRAP
|
$0.1148 | 1.1% | 14.0% | 9.1% | 38.5% | $3,203,654 | $56,887,929 | $339,821,758 | 0.17 |

|
||
| 662 |
ThunderCore
TT
|
$0.005080 | 3.0% | 0.7% | 16.8% | 16.8% | $12,097,710 | $52,756,104 | $52,756,104 | 1.0 |

|
||
| 741 |

Parcl
PRCL
|
$0.3590 | 0.1% | 5.1% | 10.8% | 25.8% | $26,472,402 | $43,077,192 | $358,976,601 | 0.12 |

|
||
| 817 |

SIPHER
SIPHER
|
$0.3720 | 0.2% | 17.2% | 157.8% | 50.1% | $197,194 | $35,592,399 | $42,453,125 | 0.84 |

|
||
| 1026 |
FLEX Coin
FLEX
|
$0.2298 | - | - | - | - | $1,668.18 | $22,670,365 | $22,686,639 | 1.0 |

|
||
| 1056 |

Solend
SLND
|
$0.5519 | 0.5% | 2.8% | 21.7% | 34.1% | $81,557.77 | $21,371,970 | $55,458,740 | 0.39 |

|
||
| 1323 |

Ref Finance
REF
|
$0.3817 | 1.1% | 0.4% | 11.4% | 18.5% | $47,466.31 | $12,652,760 | $38,203,813 | 0.33 |

|
||
| 1777 |

Everyworld
EVERY
|
$0.007822 | 1.4% | 6.0% | 18.2% | 79.8% | $100,144 | $5,389,656 | $78,131,422 | 0.07 |

|
||
| 1784 |
Anchor Protocol
ANC
|
$0.01507 | 0.0% | 5.1% | 8.7% | 8.5% | $135,761 | $5,285,865 | $15,085,688 | 0.35 |

|
||
| 1956 |

Burrow
BRRR
|
$0.006508 | 0.7% | 9.1% | 16.9% | 14.3% | $12,835.95 | $3,945,182 | $6,507,865 | 0.61 |

|
||
| 2142 |

PoolTogether
POOL
|
$0.4791 | 1.9% | 4.0% | 2.0% | 2.4% | $6,403.09 | $2,783,384 | $4,790,143 | 0.58 |

|
||
| 2229 |

saffron.finance
SFI
|
$30.56 | 6.3% | 11.7% | 8.0% | 3.6% | $62,246.70 | $2,441,374 | $2,809,727 | 0.87 |

|
||
| 2759 |

Aurigami
PLY
|
$0.0002555 | 0.3% | 2.0% | 4.6% | 37.1% | $10,785.34 | $990,864 | $2,554,931 | 0.39 |

|
||
| 2914 |
Trisolaris
TRI
|
$0.003248 | 0.0% | 1.8% | 9.8% | 7.5% | $18,741.00 | $760,429 | $537,066 | 1.42 |

|
||
| 3089 |

Finblox
FBX
|
$0.0002828 | 6.1% | 6.7% | 45.4% | 53.4% | $70,895.30 | $565,865 | $2,677,152 | 0.21 |

|
||
| 3281 |

Nebulas
NAS
|
$0.008559 | 0.5% | 4.3% | 1.6% | 0.5% | $5,074.74 | $389,375 | $855,769 | 0.46 |

|
||
| 3747 |

CoFiX
COFI
|
$0.01108 | 0.1% | 0.7% | 9.0% | 11.8% | $13,653.13 | $149,033 | $149,033 | 1.0 |

|
||

DeHorizon
DEVT
|
$0.0008990 | 0.5% | 2.0% | 4.2% | 65.3% | $3,716.64 | - | $269,703 |

|
||||

BitDAO
BIT
|
$1.00 | 0.1% | 2.6% | 1.4% | 12.8% | $303,989 | - | $9,646,910,425 |

|
||||

Opyn Squeeth
OSQTH
|
$172.29 | 0.7% | 8.9% | 9.8% | 2.8% | $19,985.63 | - | $934,150 |

|
||||
Showing 1 to 46 of 46 results
Rows
Articles related to DragonFly Capital Portfolio

Sponsored Content
What Is Ethena, ENA, and Its Synthetic Dollar USDe
CoinGecko

Analysis
The Fastest Blockchain Processed 91M Transactions in a Day
Lim Yu Qian
Market Coverage
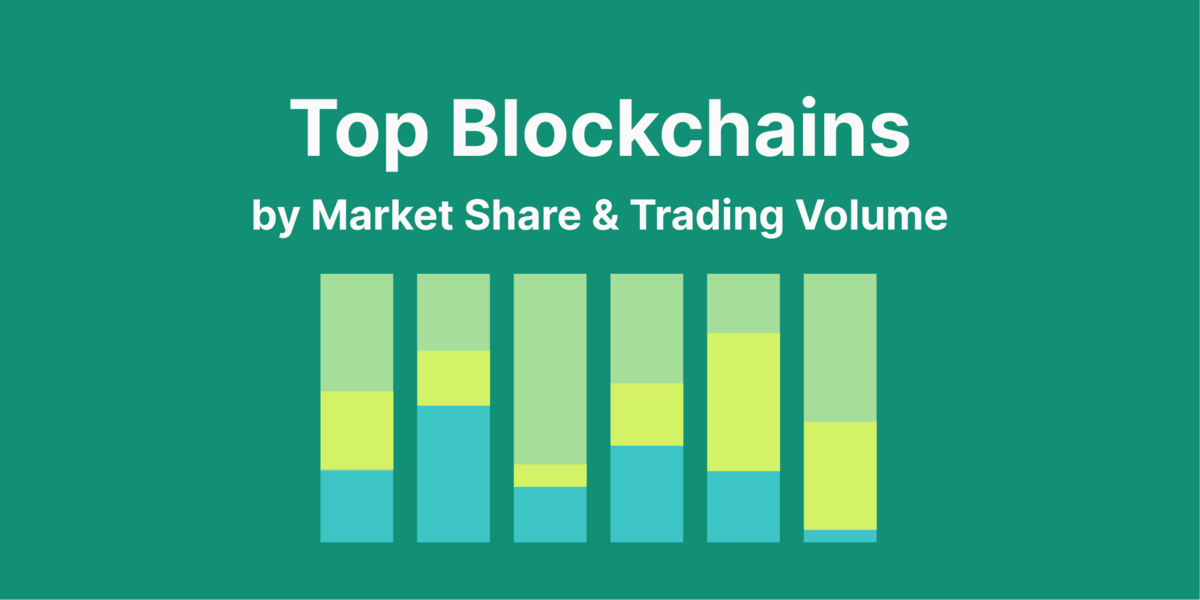
Market Share of Blockchains, by Trading Volume
Shaun Paul Lee
Market Coverage
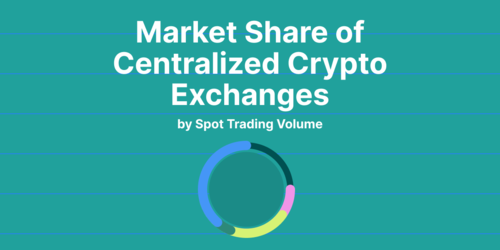
Market Share of Centralized Crypto Exchanges, by Trading Volume
Shaun Paul Lee
4.47 (43 votes)
 Or check it out in the app stores
