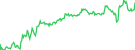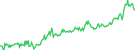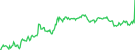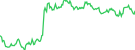




 Snapshot
The Graph (GRT) Records 15% Price Surge
1 source





The Graph Expands to 40+ Chains, Driving 15% Price Surge
| 1h | 24h | 7d | 14d | 30d | 1y |
|---|---|---|---|---|---|
| 2.3% | 7.5% | 50.1% | 33.7% | 44.5% | 69.5% |
| Market Cap | $283.132M |
|---|---|
| Market Cap / FDV | 0.94 |
| Fully Diluted Valuation | $300.513M |
| 24 Hour Trading Vol | $38.94M |
| Circulating Supply | 10.941B |
| Total Supply | 11.613B |
| Max Supply | ∞ |
 Sponsored
Sponsored
Sponsored
Sponsored
Sponsored
| 24h Range | $0.02415 – $0.02775 |
|---|---|
| 7d Range | $0.01694 – $0.02775 |
| All-Time High |
$2.84 99.1%
|
| All-Time Low |
$0.01298 99.7%
|

It is an indexing protocol and a global API aimed at organizing blockchain data, while making it easily accessible via GraphQL. Developers can use Graph Explorer to search, find, and publish all the public data they need to build decentralized applications. This makes it possible for developers build serverless dApps that run entirely on public infrastructures.
It was founded by Yaniv Tal (Project Lead), Jannis Pohlman (Tech Lead), and Brandom Ramirez (Research Lead)
They closed a $5 million private token sale funded by Coinbase Ventures, Framework Ventures, Digital Currency Group, and more; while also did a $2.5 million seed round led by Multicoin Capital. A public sale round of $12 million was also concluded few months before the launch of mainnet.

Developers can define a subgraph which specifies how blockchain data are structured to be consumed by app and dapp developers. App and dapp developers can query the network using subgraph schemas with GraphQL which are paid in GRT tokens.
These data are served by indexers who act as nodes, incentivized with GRT tokens to ensure that the API is always available in a decentralized manner and data are served correctly.
As there can be many subgraphs out there, curators are tasked to find the subgraphs that are most useful to developers. Curators are also incentivized with GRT tokens to find the best subgraph that others would find useful.
Developers are able to obtain most of the essential Ethereum data through The Graph which includes data for Uniswap, Balancer, Curve, Aave, Moloch DAO, Compound, and more.
Apps and dapps that are using The Graph includes CoinGecko, Uniswap Info, Decentraland, Synthetix, Aragon, and more.
The service have also recently expanded to offer data from other blockchains such as Binance Smart Chain, Bitcoin, Cosmos, Avalanche, Flow, Polygon POS, Arbitrum, Celo, and more.
GRT coin is the native token of the network that’s used to coordinate work. Node operators (called Indexers) can stake and earn GRT for processing queries. Anyone can delegate their tokens to indexers to secure the network and earn rewards. Curators organize data on The Graph by signaling GRT on useful APIs, called subgraphs. Indexers, Delegators, and Curators work together to organize the data for the crypto economy and maintain a useful global API for DeFi and Web3.
GRT tokens can be traded on centralized crypto exchanges. The most popular exchange to buy and trade The Graph is Binance, where the most active trading pair GRT/USDT has a trading volume of $3,706,135.82 in the last 24 hours. Other popular options include Coinbase Exchange and Kraken.
The trading volume of The Graph (GRT) is $38,049,941.93 in the last 24 hours, representing a 99.00% increase from one day ago and signalling a recent rise in market activity. Check out CoinGecko’s list of highest volume cryptocurrencies.
The Graph (GRT) reached an all-time high of $2.84 and an all-time low of $0.01298. It’s now trading -99.10% below that peak and 99.70% above its lowest price.
Market capitalization of The Graph (GRT) is $283,932,462 and is ranked #155 on CoinGecko today. Market cap is measured by multiplying token price with the circulating supply of GRT tokens (11 Billion tokens are tradable on the market today).
The fully diluted valuation (FDV) of The Graph (GRT) is $301,362,748. This is a statistical representation of the maximum market cap, assuming total number of 12 Billion ETH tokens are in circulation today.
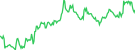
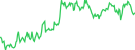
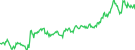
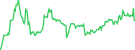
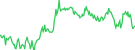
With a price increase of 50.10% in the last 7 days, The Graph (GRT) is outperforming the global cryptocurrency market which is up 11.30%, while outperforming when compared to similar Smart Contract Platform cryptocurrencies which are up 12.20%.
Adding The Graph (GRT) to MetaMask allows you to view your token holdings, trade on decentralized exchanges, and more. To add them, you’ll need to import GRT as a token. You can copy GRT’s contract address (0xc944e90c64b2c07662a292be6244bdf05cda44a7) and import it manually, or if you've installed MetaMask's chrome extension, add GRT to MetaMask with one click on CoinGecko.
Add GRT to MetaMask.






| # | Exchange | Pair | Price | Spread | +2% Depth | -2% Depth | 24h Volume | Volume % | Last Updated | |
|---|---|---|---|---|---|---|---|---|---|---|
| 1 |
CEX
|
$0.03000 | 0.08% | $26,523.25 | $32,146.84 | $3,729,930 | 8.91% |
Recently
|
||
| 2 |
CEX
|
$0.03000 | 0.12% | $30,874.44 | $68,467.63 | $2,329,623 | 5.56% |
Recently
|
||
| 3 |
CEX
|
$0.03000 | 0.03% | $25,434.66 | $29,909.59 | $146,209 | 0.35% |
Recently
|
||
| 4 |
CEX
|
$0.03000 | 0.15% | $48,897.22 | $102,513 | $922,874 | 2.2% |
Recently
|
||
| 5 |
CEX
|
$0.03000 | 0.08% | $26,693.80 | $40,338.45 | $1,330,392 | 3.18% |
Recently
|
||
| 6 |
CEX
|
$0.03000 | 0.04% | $14,310.45 | $16,622.02 | $174,448 | 0.42% |
Recently
|
||
| 7 |
CEX
|
$0.03000 | 0.16% | $13,352.80 | $20,878.03 | $1,142,100 | 2.73% |
Recently
|
||
| 8 |
CEX
|
$0.03000 | 0.08% | $21,582.93 | $18,605.19 | $254,083 | 0.61% |
Recently
|
||
| 9 |
CEX
|
$0.03000 | 0.08% | $37,631.06 | $39,423.41 | $567,928 | 1.36% |
Recently
|
||
| 10 |
CEX
|
$0.03000 | 0.19% | $15,729.14 | $17,523.71 | $654,234 | 1.56% |
Recently
|
||








 GeckoAI


 Or check it out in the app stores